Fundamental Update
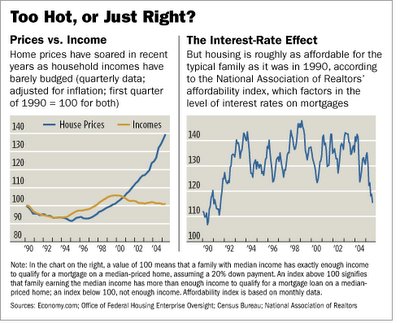
I was feverishly trying to find a graph of inflation adjusted wages to home prices yesterday, but wasn't able to find a good graph. Was going through the Wall Street Journal today, and what do you know, one of the best yet..

I often find it very hard to explain these concepts to people using words or tables, it just doesn't 'click'. But when you take a look at a chart like this, it's hard not to understand. The fact is, wages really haven't risen substantially, and neither has rent. Population has not significant increased in the past five years, which means it's highly unlikely there is a true supply issue.
Here is a link to the WSJ article, I didn't particularly care for it, but since I used the graph, I might as well provide the link back..
What's Behind the Boom
Caveat Emptor,
Grim

4 Comments:
Here is a link to the NAR first time homebuyer affordability data..
First-Time Homebuyer Affordability
Take a look at the 2005 Q3 data.
Starter home price 183k? 10% down? I'm not sure what planet there guys are at. Effective interest rate 5.8? Once this data factors in 6.5% rates affordability is going to go way down.
Even looking at the monthly affordability data:
Housing Affordability Index
Look at the Northeast for September, 248k median home price? Sorry, try almost double that. Sure, I can believe the median family income of 64k if you factor in a 248k home price. Sorry, not in Northern New Jersey.
-grim
And the real question is.. Why didn't you stop him/her?
grim
I have been following a site now for almost 2 years and I have found it to be both reliable and profitable. They post daily and their stock trades have been beating
the indexes easily.
Take a look at Wallstreetwinnersonline.com
RickJ
Hi
I came across your site a few days ago and seems to be very helpful. I have been using the various sites to assess the price that a home/apt was bought but two other things that interested me and would appreciate if you could share some light on them
1. Why do you think now is the worst time to buy a home? what are some of the down side. I was thinking that since the market is on the way down (and ofcourse no one can judge where and when the lowest point is), it would be a good way to "command" the price or as you say lowball.?
2. You also mentioned somewhere that twice the inflation rate (max) should be price that one should pay for a house that was bought x years ago and not anything more. Well i am looking in Hoboken and there if i were to go by that there is no place to find one. My calculation has been.
A. Find out the Price that the apt was bought for in whatever year
B. Add the tax every year + whatever maintenance he has paid+ his 10% down (at say 5% growth every year). Add all this to inflation rate twice of the list price of the house - and that should give the price of the apt.
It could potentially be a bit up or down depending on how hot the market (in terms of location - proximity to NYC etc).
thoughts?
Post a Comment
<< Home