Don't Get Too Excited Over Existing Home Sales
The National Association of Realtors released their existing home sales report for Febuary to much fanfare this morning.
February EHS (PDF)
While starts came in above analyst expectations, they were down 0.3% year over year (6.93 in Feb '05 versus 6.91 in Feb '06). So, after 6 months of decline which included significant drops in December and January, sales tick up.
There didn't seem to be much fanfare over the declines in median prices..
Peak Pricing versus Feb '06
United States
Aug 2005 - $220,000
Feb 2006 - $209,000 (5% decline)
Northeast (Set a record)
Feb 2006 - $263,000
Midwest
Aug 2005 - $189,000
Feb 2006 - $182,000 (3.7% decline)
South
Aug 2005 - $189,000
Feb 2006 - $182,000 (3.7% decline)
West
Nov 2005 - $332,000
Feb 2006 - $306,000 (7.8% decline)
(Declines are over the time period, not annualized)
Also of note is the fact that inventory is up to 5.3 months supply. Actual inventory has increased over 30% year over year.
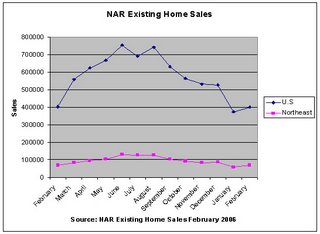
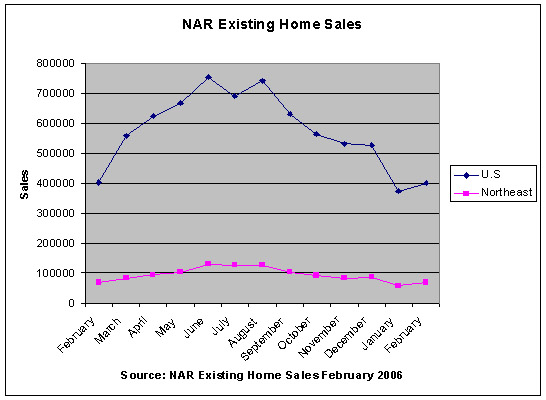
Sales in the Northeast (unadjusted)
Febuary '05 - 68,000
January '06 - 58,000
Feburary '06 - 70,000
Let me note that these sales volumes do not reflect what we saw in Northern NJ over the same time period. Sales in Northern NJ (GSMLS only) declined approximately 18% in February (1705 to 1395).
Caveat Emptor!
Grim
February EHS (PDF)
While starts came in above analyst expectations, they were down 0.3% year over year (6.93 in Feb '05 versus 6.91 in Feb '06). So, after 6 months of decline which included significant drops in December and January, sales tick up.
There didn't seem to be much fanfare over the declines in median prices..
Peak Pricing versus Feb '06
United States
Aug 2005 - $220,000
Feb 2006 - $209,000 (5% decline)
Northeast (Set a record)
Feb 2006 - $263,000
Midwest
Aug 2005 - $189,000
Feb 2006 - $182,000 (3.7% decline)
South
Aug 2005 - $189,000
Feb 2006 - $182,000 (3.7% decline)
West
Nov 2005 - $332,000
Feb 2006 - $306,000 (7.8% decline)
(Declines are over the time period, not annualized)
Also of note is the fact that inventory is up to 5.3 months supply. Actual inventory has increased over 30% year over year.
Sales in the Northeast (unadjusted)
Febuary '05 - 68,000
January '06 - 58,000
Feburary '06 - 70,000
Let me note that these sales volumes do not reflect what we saw in Northern NJ over the same time period. Sales in Northern NJ (GSMLS only) declined approximately 18% in February (1705 to 1395).
Caveat Emptor!
Grim

20 Comments:
But that bump was enough for Wall Street to change their predictions toward more rate increases in the future. Recently they believed the March 28 meeting would be the last or next to last increase.
I know the Fed says they don't take on equity Bubbles, that they only clean up afterward. But I believe that they are actually trying to put downward pressure on the housing market.
March's results should be very intesting!
I meant Interesting!
10Y yields made a big jump up this morning..
I really don't believe the jump was due to the initial claims numbers..
Chicago?
grim
$50,000 price drop:
MLS 2214567
38 Lum Ave, Chatham
$749,999 => $699,000
Days on Market: 93
We couldn't keep up with the payments," she explained one dreary, wet Sunday morning in late winter. "The payments went from $1,700 a month almost to $3,000 a month, so this being my first home, my dream home, I had to lose it."
How can this be when ARMs have rate caps of about 2%? Also, do interest only loans have rate caps?
I'm confused
Tony
$40,000 price drop:
MLS 2233189
90 Woodland Rd, Chatham
$589,000 => $549,000
Days on Market: 77
Are the Chatham homes New World, Old World, or Third World charm?
Steve
Tony,
Likely a Neg-AM ARM with a teaser rate.
You can't tell me you haven't noticed the signs across NJ adversiting a 1.25% rate.
What happens is the first year you only pay the 1.25%. During that time your mortgage is negative amortizing (principle is increasing by the difference in the actual payment). When the arm recast hits, you don't just go to up by 2% (or whatever the mortgage says), you go up to whatever the current rate is. For example, she might have gone from 1.25% to 5.75%. However, keep in mind that her principle amount increased over that period as well.
And that's just the first shock. Short term rates are on an upward tear. She's likely to recast upward the next year as well.
jb
How does new construction (sold directly from the builder and often not listed in MLS) get worked into these figures?
Also, are any stats available on the median price per sq foot v. overall median price?
grim:
In my opinion, when the Ten broke through 4.60% and held that level at the beginning of the month, it was significant. Everything else since that juncture is just noise.
Based on the behavior of the fixed income markets, no one has a clue what Bernanke is going to do, despite all the nice storylines than financial journalists seem to want to build into their reporting.
Consensus earlier this month was that there were two more tightenings coming. Suddenly some weakness in Month over Month numbers appeared [i.e. noise - January had warm weather, and February was a normal February]. Economists started making calls that 5% Fed Funds was not a lock.
Now, I think people might be thinking 5.25% [March, May, and June]. Whatever......
Unless we sell off through 5% on the Ten and hold that level, it should NOT be considered a factor on the margin. Meaning - someone with an ARM whose rate is expiring won't be unduly injured - people with option-ARMs, I/O and other assorted detritus are dead in the water regardless of whether the Ten is at 4.50%, 5% or 6%.
chicago
Richard said...
mark my words, the Fed will raise to at least 5.5%. that means 3 more hikes. they always overshoot.
Richard:
The idea about the Fed is that they could have overshot already with the rate at 4.5%. We won't know for several months.
chicago
Hi Chicago or Grim,
I'm only vaguely familiar with the bond markets and how rates on Treasury notes affect lending rates. Could either of you point me to a "Bonds for Dummies" site or maybe take a crack at explaining the correlation across the two types of debt.
JM
Rolling boom, last gasp.
I don't know where the strength in the Northeast came from, but it surely wasn't from North Jersey.
Otteau numbers for February will be out at the end of next week. I don't expect to see the NJ Association of Realtors Q1 numbers until well into May.
Has anyone noticed a lack of FSBO's lately?
I've seen a number of Foxtons listings lately. Or, it might just be that I've been looking for them and ignoring others.
Unfortunately those numbers aren't easily available and it's difficult to rely on anecdotal evidence.
jb
Skeptic,
Would you please let us have a link to the article in the new york times about boomers in New York cashing out?
Thanks.
Grim-
something is wrong with your chart.. maybe you need two axes..
For example, you show northeast home sales going over 100000. They only went to 870000 in april. They are at 850000 now.
The national number is also messed up- they never went to 7.5 anything.. you show 750000, but those numbers should be in the millions and they never went over 6.28 mil.
No my anonymous friend. You are just looking at a different set of numbers than I plotted.
The graph displays the unadjusted monthly figures. The figures that you mention are the seasonally adjusted and annualized numbers.
I'm not a fan of adjusted and annualized numbers
grim
Northeast may have set a record in part because of one $25,000,000.00 sale for a SFR in Edgartown, MA.
I have been following a site now for almost 2 years and I have found it to be both reliable and profitable. They post daily and their stock trades have been beating
the indexes easily.
Take a look at Wallstreetwinnersonline.com
RickJ
Post a Comment
<< Home