Northern New Jersey May Residential Sales
Preliminary May sales data for Northern New Jersey is in..
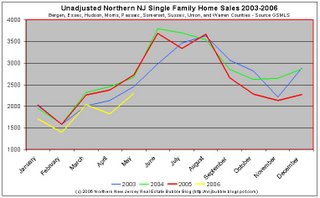
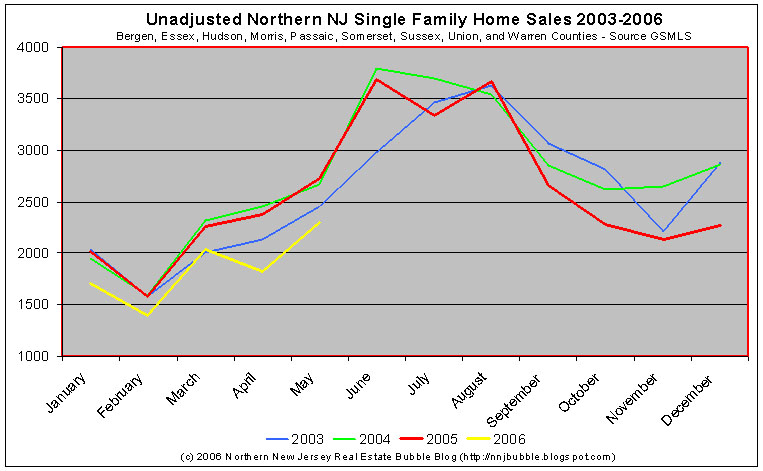
The first graph plots the unadjusted sales data (closed sales) for the counties listed. Please note the lower bound of the y-axis, it is set to 1000, not to zero. I do this to emphasize the seasonal nature of the Northern NJ market.
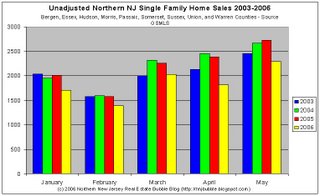
The second graph displays the same sales data (2003-2006) for the first four months of the year. Again, please not the y-axis, this time it does cross at zero.
For those who prefer the hard numbers:
January
Average Sales (2003-2005): 2000
2005 Sales: 2013
2006 Sales: 1705
(Down 15.3% Year Over Year)
February
Average Sales (2003-2005): 1583
2005 Sales: 1578
2006 Sales: 1395
(Down 11.6% Year Over Year)
March
Average Sales (2003-2005): 2193
2005 Sales: 2256
2006 Sales: 2033
(Down 9.9% Year Over Year)
April
Average Sales (2003-2005): 2322
2005 Sales: 2383
2006 Sales: 1817
(Down 23.8% Year Over Year)
May
Average Sales (2003-2005): 2615
2005 Sales: 2725
2006 Sales: 2298
(Down 15.7% Year Over Year)
Data above is GSMLS Sales for Bergen, Essex, Hudson, Morris, Passaic, Somerset, Sussex, Union, and Warren Counties.
Caveat Emptor!
Grim
The first graph plots the unadjusted sales data (closed sales) for the counties listed. Please note the lower bound of the y-axis, it is set to 1000, not to zero. I do this to emphasize the seasonal nature of the Northern NJ market.
The second graph displays the same sales data (2003-2006) for the first four months of the year. Again, please not the y-axis, this time it does cross at zero.

For those who prefer the hard numbers:
January
Average Sales (2003-2005): 2000
2005 Sales: 2013
2006 Sales: 1705
(Down 15.3% Year Over Year)
February
Average Sales (2003-2005): 1583
2005 Sales: 1578
2006 Sales: 1395
(Down 11.6% Year Over Year)
March
Average Sales (2003-2005): 2193
2005 Sales: 2256
2006 Sales: 2033
(Down 9.9% Year Over Year)
April
Average Sales (2003-2005): 2322
2005 Sales: 2383
2006 Sales: 1817
(Down 23.8% Year Over Year)
May
Average Sales (2003-2005): 2615
2005 Sales: 2725
2006 Sales: 2298
(Down 15.7% Year Over Year)
Data above is GSMLS Sales for Bergen, Essex, Hudson, Morris, Passaic, Somerset, Sussex, Union, and Warren Counties.
Caveat Emptor!
Grim

37 Comments:
January - Down 15.3% YOY
February - Down 11.6% YOY
March - Down 9.9% YOY
April - Down 23.8% YOY (the "spring bounce"!)
May - Down 15.7% YOY
That spring bounce looks promising, as Liareah would say, a "moderation" of the market.
More than 700 on the market in the past week!
"Currently, there are 30,721 properties advertised for sale in NJ on our site. For Residential Properties that are Multiple Listed with Garden State, 99% are available to be searched on this site.
http://www.gsmls.com/
...but it's only 427 less than last year's which is supposed to be the hottest year.
besides the fact that this year is not as hot as last year's pace I still don't see any hard evidence of significant price declines or that we're definitely heading there. or the bottom falling out as some say.
what's going on?? I sure hope we start seeing some hard indisputable evidence we can bring with us while shopping for houses!! need house now!! :)
I would love to see the numbers for 1999 to 2002 included. Too bad they are not available, then we would be able to see what normal looks like.
I would think that the 2006 numbers are still higher than 2002.
June is going to be very interesting.
It's a standoff between buyers and sellers. Sellers don't want to sell for less than last years prices and buyers don't want to pay for last years prices.
Sellers are in denial right now.
Delford, where are you seeing prices go up?
I've yet to see that in Summit, Chatham, etc, and in fact am watching prices steadily go down as houses sit for months.
Starting to get interesting:
MLS# 2273011 - Blairstown Twp.
Listed 5/1/2006
Original List Price: $589,000
List Price: $539,000
Last Sold 9/6/2005: $559,000
X-Underwriter said...
"What this means to me is to expect NJ to go down but not as much, in percentage terms, as some of the others above it. NJ will go down but won't tank like DC."
IMO, DC is less vulnerable than NJ. Alot of Homeland Security startups in NOVA and Government grew under this administartion meaning more jobs. Fairfax and Loudon counties have downzoned reducing supply like many places in NJ.
X-Underwriter,
You may be right. This is all uncharted territory. I bought in the last bubble and somehow this one feels alot crazier. Maybe people down there are over extending to get in like elsewhere in the bubble areas. My Sister and brother-in-law assure me that DC is different somehow and they are kind of plugged in down in Faifax (for that matter almost everywhere).
So what should I do?
Bought this place in 1975 for just under $200K. Mortgage long since paid off. Took out a home equity line to make some improvements over the years (kitchen, baths), but that's all paid off now, too.
Last year at this time, a house very similar to mine sold for close to ten times what I paid for mine. Yes, you're reading that right--10 times more. The town I live in has great schools and very restrictive zoning, and no more land to build on. Taxes are very reasonable, too.
I'm starting to think about retiring and moving south, but there's no rush. Do I sell now, as you folks are urging? Or do I just plan to hold on and hope things recover?
Metro, I have some data covering that time period, I'll see what I can dig up.
jb
Anon 1975 Buyer,
Depends on your age. If you're near retirement age, and are open to living in another part of the country, I'd strongly consider 'cashing out.'
Last year is over, but say you can get $1.6M, that's a boatload of cash.
You can buy a palace in Raleigh/Durham North Carolina for $600K, and live off the $1M left over.
Some compelling numbers.
Do some searching online, you'll probably find some choice properties in choice locations (e.g., overlooking a golf course), for well under even $600K. Check out realtor.com
Thanks Grim! I think it will give us an idea of what normal is.
Great thread over on The Big Picture. $ graphs pointing toward the downturn in the economy and housing. A compelling argument and as always a very informative blog.
http://bigpicture.typepad.com/comments/2006/06/housing_leads_t.html
I meant 4 graphs. I am so used to using the shift key at the beginning of a sentence.
May Sales
Year/Sales
2000: 2467
2001: 2359
2002: 2478
2003: 2456
2004: 2663
2005: 2725
2006: 2298
This is from the same dataset as I provided in the main post.
grim
I am a strong believer that RE will decline over the next 5 years and will hot rock bottom (anywhere from 32-40% less than peak 2005 prices). Unfortunately I am not in a position to wait that long and have to buy a house soon due to reasons out of my control. Now I hear about these new Schiller Options/Futures available on the CBOE to hedge against housing price declines in select markets, the tristate area being one of those markets. They have started trading very recently. Has anyone heard of how to play these and if they are really reliable? Would really appreciate some insights. Thanks...
I would think that the 2006 numbers are still higher than 2002.
What do you think now?
grim
Thanks, I am impressed. We are going down and this is just the beginning. Do those same data sources have number of units on the market in a given month?
Seeing a bunch of "Motivated Seller" and "Seller Motivated" in listings.
Wonder if it's a trend worth noting?
Something must be happening, because I have these bloodthirsty posters on my home site raging for my freaking head.
Grim - Have you heard of this site:
http://www.corzen.com/realestate/index.aspx? Is it reliable if they use NAR data? Thanks.
jj
It will be fun watching the greedy money grubbing sellers and the realtors feuding.
BOOOOOOOOOOOOOYcott Houses!
Bob
Be a pro be polite BUT BLEED"EM DRY!
Do get sucked into to the spin-game of motivated seller and price reductions.
You should bid at least 30%+ less than PEAK 2005 summer prices. Watch for the phoney markdowns from inflated levels.
Tell'em NO MAAS!
Bababababababa
BOOOOOOOOOOycott!
Bob
The new blog would be live if it wasn't so difficult to migrate old posts and comments to the new software.
The software comes with a tool to automagically migrate the data. It's supposed to work like a dream...
All I can do is get it to crash.
But because my net access is going to be spotty over the next week, I'm hesitant to make any other changes now.
I'm going to be out of the country for the next few days. Don't know how available internet will be.
grim
http://www.usatoday.com/money/perfi/housing/2005-08-17-housing-valuations.htm
According to this we are only 23% overvalued - I have done absolutely no research on what they used as their basis for this, but I figured someone here has and that they might be able to piece it together.
If it is a legit study, how does this affect the predictions for a correction?
Another 40 added since 2:00PM:
"Currently, there are 30,768 properties advertised for sale in NJ on our site. For Residential Properties that are Multiple Listed with Garden State, 99% are available to be searched on this site."
http://www.gsmls.com/
The average sales per month for the past five months is 1,850 and when divided into the current inventory of 30,768 we get 16.6 months of inventory for Northern NJ.
Let me repeat: there is currently 16.6 months of inventory for Northern NJ.
JJ- I saw that on inman today, linked to it, and asked about it on Grim's new forum, under both NJ Bubble and National Bubble, so maybe check there to see if anybody comments.
Pat
Check out this article on CNNMoney.com entitled "Overpriced Housing Gets More Overpriced."
http://money.cnn.com/2006/06/12/real_estate/overvaluation_even_worse/index.htm
Thanks Pat
Not making any move buying RE without running info. through these blogs!
jj
"you probably should use seasonally adjusted numbers to get a good idea of inventory."
Do you have them? I averaged the last 5 months of sales, and divided into current inventory of 30,768.
RE investor is conspicuous by absence
Come on RE investor, share with us.
How many properties are you currently holding? Are they single family? Renovations? Tear downs?
@RE Investor
missing bob??
check out
6/12/2006 06:51:59 PM ,
6/12/2006 06:55:01 PM
You don't seem to be thinking straight. I hope everything is fine.
an Ad ARTICLE AT
Asbury Park Press
Sunday May 28, 2006
p.G3 !!!
"Kara Homes advises active adults to purchase homes now" !!!
Why buy homes when you knew that New Jersey home prices is way overpriced according to the latest report and Housing prices is now cooling if not CRASHING !!!!
The average home is currently on the for about 4 months before it goes to contract. Around 15% of initial real estate contracts never make it to a successful closing ... something goes wrong, and the frustrated seller puts the home back on the real estate market .
Post a Comment
<< Home