Saturday, November 05, 2005

Congratulations Lowballers!

A big congratulations out to the successful lowballers this week. For those that don't understand the term, a lowballer is someone who offers significantly under asking in hopes that the seller accept the offer (for whatever reason). I'd like to personally thank this weeks lowballers for providing hard evidence that sellers can, and will, accept significantly lower offers than the industry would lead us to believe. To all prospective buyers reading this blog, while I won't endorse buying in todays market, if you must buy, at least use the leverage you do have as a buyer, you might be very surprised at the result.

The list please!
MLS# 2104202 - Orange Ave, Elmwood Park, Listed at $460,000, Sold at $328,000 (28% Reduction)

MLS# 2075472 - Lakeside Blvd, Roxbury, Listed at $209,000, Sold at $155,000 (26% Reduction)

MLS# 2090124 - Far Hills Road, Springfield, Originally Listed at $719,000, Reduced to $669,000, Sold at $500,000 (25% Reduction from Reduced Price)

MLS# 1677437 - Mountain Ave, Pequannock, Listed at $1,500,000, Sold at $1,150,000 (23% Reduction)

MLS# 2104393 - Fox Chase Road, Chester, Listed at $1,090,000, Sold at $845,360 (22% Reduction)

MLS# 2076961 - Franklin Street, Hackettstown, Listed at $279,000, Sold at $229,000 (18% Reduction)

MLS# 2088435 - Andrea Court, Paramus, Listed at $1,425,000, Sold at $1,200,000 (16% Reduction)

MLS# 2091116 - Willow Grove Road, Westfield, Listed at $1,450,000, Sold at $1,262,000 (13% Reduction)

MLS# 2100547 - Mountain Ave, Berkeley Heights, Listed at $399,000, Sold at $350,000 (12% Reduction)

This was just a very small sampling, over 455 sales has successful lowball offers from Sunday October 29th, until this morning.

Caveat Emptor,
Grim
Thursday, November 03, 2005

October 2005 Sales

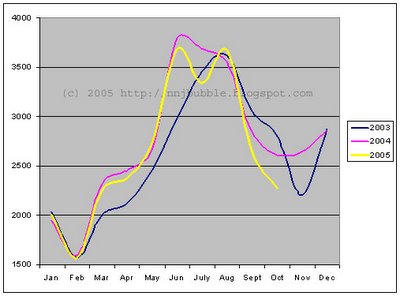
Here is perhaps the most interesting of the October data. I provided this chart for the first time last month, and will continue to update it in the future. The chart overlays the monthly sales data for 2003, 2004, and 2005. The data is not seasonally adjusted so that you can view the actual sales data and make your own assumptions about trends in activity. This data is based on sales activity for Bergen, Essex, Hudson, Morris, Passaic, Somerset, Sussex, Union, and Warren Counties. This chart is based on GSMLS data only.


I think it's quite obvious to see that sales this year have dropped off rather significantly after the end-of-summer peak. We're headed into the early winter slump rather quickly and steeply. It will be very interesting to see how this data plays out over the next few months.

Caveat Emptor,
Grim

October Active Inventory Update

October Inventory Data is in, it took me a bit longer than usual to compile the data and post it up, so I apologise for that. We're still pushing ever higher with the listings. The rate of increase seems to have tempered a bit from last month, however is still maintaining a strong upward trend.

GSMLS

Total Active Listings
Oct 1 - 12441
Oct 31 - 12821 (2.4% Increase)

Bergen
Oct 1 - 827
Oct 31 - 880 (6.0% Increase)

Essex
Oct 1 - 1915
Oct 31 - 1980 (2.8% Increase)

Hudson
Oct 1 - 99
Oct 31 - 99 (0.0%)

Morris
Oct 1 - 2535
Oct 31 - 2586 (2.0% Increase)

Passaic
Oct 1 - 1386
Oct 31 - 1430 (3.1% Increase)

Somerset
Oct 1 - 1660
Oct 31 - 1750 (5.1% Increase)

Sussex
Oct 1 - 1570
Oct 31 - 1560 (0.6% Decrease)

Union
Oct 1 - 1760
Oct 31 - 1793 (1.8% Increase)

Warren
Oct 1 - 799
Oct 31 - 797 (0.2% Decrease)

NJMLS

Total
Oct 1 - 5494
Oct 31 - 5784 (9.1% Increase)

Bergen
Oct 1 - 3973
Oct 31 - 4139 (7.7% Increase)

Essex
Oct 1 - 375
Oct 31 - 436 (16.7% Increase)

Hudson
Oct 1 - 384
Oct 31 - 394 (7.6% Increase)

Passaic
Oct 1 - 762
Oct 31 - 815 (12.5% Increase)

Hudson County MLS

Hudson
Oct 31 - 1729 (For reference)

There was a burst of sales, withdrawl, and expiration activity towards the end of the month that pushed many of the active listings numbers down on the 31st of the month. Many counties had numbers a few tenths to whole percentage points greater around the third week of the month. This activity is typical.

Caveat Emptor,
Grim

Wednesday, November 02, 2005

Mortgage Rates Increase, Applications Drop.

Mortgage rates increase for the Seventh week in a row. The increases over the past three weeks have been rather significant at that.

Weekly Home Mortgage Rates

The rapid increase in mortgage rates have significantly impacted both new mortgages and refinancing.

U.S. Mortgage Applications Fall to Lowest Since April

``New purchase and refinancing activity are crumbling,'' said Steven Wood, chief economist at Insight Economics in Danville, California. ``While housing activity remains relatively high and continues to contribute to economic growth, that contribution will quickly fade as mortgage rates continue to rise.''

The purchase index fell 6.2 percent to 437.6, from 466.4 the week earlier. The refinancing gauge decreased 2.8 percent to 1862.8 from 1916.8.

U.S. homeowners will turn a record $204 billion of real- estate equity into cash this year by refinancing mortgages at higher balances to take advantage of gains in property values, Freddie Mac said yesterday.

The increase in mortgage rates as well as the decrease in buyer activity will have a significant impact on home prices in the coming months.

Caveat Emptor,
Grim

Will the housing bubble bust hurt NJ? Unfortunately, Yes.

Unfortunately, when the housing bubble bursts, it's not going to just manifest itself in home prices correcting. We're going to see alot of pain in many of the housing related industries, including construction, etc. Much of the job growth we've seen in the past few years has been directly related to the housing boom. When the boom goes, so do those jobs, putting further downward pressure on real estate, in a viscious positive feedback cycle.

I'm not sure how I missed this Businessweek piece last week, but it's a big one that pushes Northern NJ into perhaps the riskiest position in the country.

Where a housing bust will hurt most

Hardest hit will be areas where construction is providing the most new jobs, not necessarily the places that have seen the greatest appreciation.

That's raising a crucial question: If the housing market turns south, where is the economic damage likely to be the greatest? Places where prices fall a lot will feel the hit, of course. But the greatest economic impact may not come where prices slide the most. Instead, the regions that see the most pain probably will be those where homebuilding has been a major source of new jobs. A decline in housing could accelerate job losses in the entire local economy, as happened in Los Angeles in the early 1990s, when aerospace layoffs and an ensuing housing slowdown led to a 10% decline in overall employment.

Where construction is doing the heavy lifting

1) Bergen-Passaic, NJ 71%
2) Columbus, OH 68%
3) Buffalo-Niagara Falls, NY 62%
4) Riverside-San Bernardino, CA 33%
5) San Diego, CA 31%
6) Milwaukee-Waukesha, WI 29%
7) Phoenix-Mesa, AZ 25%
8) Oakland, CA 24%
9) Cincinnati, OH-KY-IN 23%
10) Los Angeles-Long Beach, CA 22%

Regions that are heavily dependent on housing for employment growth will suffer more than most when a downturn comes. And there's no doubt that a reversal in the market will come eventually. Nationally, the economy's dependence on housing is worrisomely heavy. Since the beginning of 2000, residential investment -- i.e., the construction and remodeling of homes -- has grown 32% after inflation, more than double the 14% growth of U.S. gross domestic product. Economy.com chief economist Mark M. Zandi calculates that one-fourth of America's economic growth since 2000 is due to housing.

...

So there you have it folks, there is a good chance that Northern NJ might be the riskiest bubble market in the country. Not only does our housing market stand to fall rather significantly (20-30% by some estimates), but we may also lose a significant number of existing and newly created jobs.

Caveat Emptor!
-Grim

"I cannot guarantee that there will be no hard landings." - David Lereah, NAR Chief Economist & SVP

Regular readers to this blog will know who Dr. David Lereah is. If you don't, he is the biggest real estate cheerleader there ever was. David is a Senior Vice President and Chief Economist for the National Association of Realtors (NAR).

Biography: David Lereah

Dr. Dave has been one of the biggest anti-bubble spokesmen on the scene, which is expected given the organization he is a spokesman for. However, it seems that Dave and the NAR are quickly changing their story. Why you ask? If there is no bubble why would they change their story so quickly? Well, it's because they always knew there was a bubble, but they did everything they could to keep the party going. Now that it's obvious the real estate market is going to take a significant downturn in the upcoming year, they are covering their backsides.

Lereah made some comments a few days ago, that caused many people to double take. In fact, I needed to read the article two or three times, I just didn't believe these words came out of Lereah's mouth in this article:

Housing Boom Fading, Leading Real Estate Economist Says

"The boom is showing some signs of tiring," David Lereah, chief economist with the National Association of Realtors, said Friday.

"We are projecting a significant drop in the price appreciation pace," Lereah said.

But even though the velocity of the housing market will subside, "we are looking for a soft landing," he told real estate agents from across the country who are meeting in San Francisco.

"Some markets are more susceptible to interest rate risks and shock," he said. "I cannot guarantee that there will be no hard landings."

When David Lereah, Chief Economist and Head Cheerleader for the NAR says there is a possibility of a hard landing, run, do not walk, to the nearest exit. This is no time to be thinking about, or actually buying a home. To all the prospective buyers on the market. Sit tight, your time is coming.

Caveat Emptor!
Grim

Why has this property not sold?

The bubble is getting major media coverage now, and the tone of the articles has quickly moved from "what bubble" to "when?".

Overheated housing market is cooling off

Signs of cooling have created angst among real estate agents. "You now have agents in the office walking over to other agents asking, 'Why has this property not sold?' " says Martinez, an agent at Century 21 Lois Lauer Realty in Redlands, Calif.

In what could signal a mood shift in the feverish real estate market, tales of bidding wars and 30% annual price gains are quietly fading.

Instead, there's nervous chatter about the recent increase in the number of homes for sale, sellers cutting their asking prices and builders wooing buyers with incentives.

The reason: There are signs that the overheated market might finally be cooling. The Commerce Department, for example, said sales of new homes in September fell shy of expectations, median prices declined 5.7%, and the number of new homes for sale shot up to a record 493,000. Freddie Mac also said October mortgage applications seem to be "tapering off."

While confident real estate agents rule out a double-digit price downdraft, such as the one Dallas saw in the early '80s, the risk of sizable price drops can't be ruled out, a recent PMI study said. Its "Market Risk Index," based on an analysis of the 50 biggest markets, found a 22% chance of a price decline in the next two years. PMI estimates home prices are overvalued by 33.7% in Los Angeles, 25.6% in central New Jersey, 25.5% in Las Vegas, and 18.2% in Washington, D.C.

Caveat Emptor,
Grim

Tuesday, November 01, 2005

Seems Bergen isn't Bubblewrapped

Seems like the cheerleader predictions of Bergen being bubblewrapped are unfounded, just like all the rest of the real estate mythinformation going around.

Off today's hotsheet:

Price Changes
Allendale $1325000 Reduced to $129500
Edgewater $859000 Reduced to $779000
Fort Lee $639000 Reduced to $629000
Glen Rock $735000 Reduced to $709000
Hillsdale $759000 Reduced to $739000
Mahwah $329900 Reduced to $322900
Oakland $599000 Reduced to $579000
Oakland $895900 Reduced to $894900
Ramsey $669000 Reduced to $649000
Ridgewood $1285000 Reduced to $1199999
Rutherford $535000 Reduced to $492500
Saddle River 1800000 Reduced to $1725000
Teaneck $488900 Reduced to $479500
Waldwick $729000 Reduced to $699900

Sold
Allendale $384900 Sold at $370000
Hohokus $639000 Sold at $607000
Mahwah $405900 Sold at $399500
Paramus $1425000 Sold at $1200000
Ramsey $469900 Sold at $439999
Rutherford $325000 Sold at $308000
Rutheford $520000 Sold at $505000
Teaneck $329709 Sold at $327000
Wyckoff $925000 Sold at $890000

I don't get it, I thought Bergen County was wrapped in magical bubblewrap that protected it from market behavior? As always, don't bother trying to catch a falling knife, you'll only get cut.

Caveat Emptor,
Grim

Fed increases rates 25bp

The Fed raised rates 25 basis points again this afternoon. Hardly unexpected, this move was widely expected.

Fed Raises Target Rate to 4%, Keeps `Measured' Plan

The Fed statement was much of the same. Nothing new, but then again, much of what we all expected to hear. Doesn't look like the rate increases will stop anytime soon. I am beginning to believe we'll see rate increases into the first few months of Bernankes term as well.

Notable:

The Federal Open Market Committee voted unanimously to lift the overnight bank lending rate a quarter-point to 4 percent

Caveat Emptor,
Grim

Monday, October 31, 2005

Savings Rate Negative Again

The personal savings rate for September was released at 8:30am this morning.

Personal Income and Outlays

Savings rate was again negative, for the fourth month in a row, at -0.4%. The August savings rate was revised downward from somewhere around -0.7% to -1.8%. The American Consumers are continuing on their consumption and spending binge, dipping further into savings to finance the party. While incomes did increase a bit this month, spending increased as well (a very American concept: I Make, Therefore I Spend).

As we move into the holiday spending season with energy prices rising, this figure looks to stay in negative territory for the next few months. How long can the spending and credit binge continue?

Caveat Emptor,
Grim

Treehouse Condo Conversions

I thought I'd start everyone off this week with a good laugh. There is a condo for sale on Valley Road in Montclair, near the Montclair State campus, that you just won't believe. Now, I'm sure most everyone is familiar with the concept of condo conversions, a property owner basically converts all apartments on the property into condos, and sells them off for a hefty profit. This is much more common on the west coast than in NJ, however, I have seen my fair share. This has got to be the most bizarre condo conversion there ever was. This building is right next door to a rather large house (which I believe was already split up). The only way I can describe this 'condo' for sale is to call it a tree house. Perhaps it was the pool house at one time, or maybe just the kids playhouse, but whatever it is, it sure isn't a house. Take a look:


I'm sorry if it's a bit hard to see, it seems to be a two level structure, slightly larger on the top. I couldn't get close enough to shoot a better picture, but I can confirm it's got utilities and is definately a residence. Hey, it's got a pool too. I tried calling the realty company to get a price, but there was no one available on Sunday.

If this isn't the most perfect illustration of a manic market, I don't know what is. What's next condo conversions of garages?

Caveat Emptor,
Grim