Saturday, February 18, 2006

Weekend Open Discussion

Open Discussion for this weekend

Observations about your local areas, comments on news stories or the New Jersey housing bubble, Open House reports, etc. If you have any questions you wanted to ask earlier in the week but never posted them up, let's have them.

For readers that have never commented, there is a small link on the bottom of each new message that reads "# Comments". Go ahead and give that a click, you might be missing out on a world of information you didn't know about. While you are there, introduce yourselves to everyone.

For new readers that have only read the messages displayed on the main page, take a look through the archives, a substantial amount of information has been put online in the past 6 months. The archives can be found at the bottom of the right hand menu and are categorized by month.

Caveat Emptor!
Grim

Lowball! 2/8-2/18

Lowball! takes a look at home sales over the past week from a very different perspective. For those new to Lowball!, a lowball offer is when a buyer offers a significantly lower bid than asking in hopes that the seller accepts the offer. We take a list of home sales over the past week and pick out the sales that have the highest percentage difference between asking price and selling price.

Lowball! is to show buyers that the market has changed and buyers now have considerably more leverage than sellers. Just a short time ago, lowball offers would have been laughed at and discarded, however, not any more. The fact that so many under-asking offers are being accepted is clear proof that the market is changing.The list does not contain all sales, I hand-pick the most interesting sales from the list. These listings might be the highest dollar drops, biggest percentage reductions, or sales in towns that are thought to still be 'hot'. Please note, even with double digit percentage reductions, these homes are still incredibly overpriced.

Let's try a new format this weekend, I'll call it High/Low. We'll drop out the middle of the market and take a look at the high and low sides. On to the list(s)!

High
MLS# 2225447 - Verona, NJ
Asking Price $1,299,000
Sales Price $1,117,500 (13.97% Lowball!)

MLS# 2096174 - Bernardsville, NJ
Asking Price $1,150,000
Sales Price $999,999 (13.04% Lowball!)

MLS# 2078155 - Westfield, NJ
Asking Price $5,295,000 (Reduced from $5,895,000)
Sales Price $4,625,000 (12.65% Lowball!, 21.5% off OLP)

MLS# 2206653 - Green Brook, NJ
Asking Price $1,099,000
Sales Price $985,000 (10.37% Lowball!)

MLS# 2203630 - Millburn, NJ
Asking Price $1,450,000 (Reduced from $1,549,000)
Sales Price $1,300,000 (10.34% Lowball!, 16% off OLP)

MLS# 2102538 - Mountain Lakes, NJ
Asking Price $1,990,000 (Reduced from $2,100,000)
Sales Price $1,800,000 (9.95% Lowball!, 14.3% off OLP)


Low
MLS# 2094705 - Irvington, NJ
Asking Price $110,000
Sales Price $70,000 (36.36% Lowball!)

MLS# 2207199 - Morristown, NJ
Asking Price $349,000
Sales Price $236,000 (32.38% Lowball!)

MLS# 2106160 - East Orange, NJ
Asking Price $119,900
Sales Price $95,000 (20.77% Lowball!)

MLS# 2103974 - Linden, NJ
Asking Price $249,000 (Reduced from $260,000)
Sales Price $205,000 (17.67% Lowball!, 22% off OLP)

MLS# 2098813 - Paterson, NJ
Asking Price $399,000 (Reduced from $414,000)
Sales Price $340,000 (14.79% Lowball!, 17.87% off OLP)

MLS# 2205942 - Passaic, NJ
Asking Price $239,900 (Reduced from $289,900)
Sales Price $208,000 ( 13.29% Lowball!, 28.25% off OLP)

Caveat Emptor!
Grim

Friday, February 17, 2006

Thorns and Bubbles and Crashes.. Oh My!

Some more 'required' reading to keep you busy over the weekend. This piece comes from Will Carless at the Voice of San Diego.

Thorns Aren't Good for Bubbles

Highlights:

Buy a house, just don't expect to make any money on it until 2012. Get a mortgage, just don't get a negative-amortization loan or an interest-only loan, because you may well find yourself foreclosing on it. Read the press releases from National Association of Realtors, just don't believe them.

That's just three of the gems Chris Thornberg, a senior analyst at the University of California, Los Angeles Anderson Forecast spent an hour showing off and polishing Thursday morning.

...

He said the real estate market has witnessed nothing less than an extraordinary run-up in prices, with 10 consecutive quarters of above-average price growth. At the same time, Thornberg said, while employment has remained steady, job growth has been in sectors directly related to the real estate boom. A boom constructed around building homes, trading homes and remodeling homes is simply unsustainable, he said.

The real estate fire has been fanned primarily by consumers, Thornberg said, who have spent themselves into the lowest private-savings rate in the United States ever. The average American now spends more than they save, he said, and this "spending binge," -- which is being mirrored by the federal government -- has led to the economy becoming "seriously out of whack."

...

Thornberg said all the statistics show that he was right to be concerned. In the past, when the real estate market has seen bubble-type home price appreciation, things have been more measured. In the bubble of the 1970s, home prices appreciated 55 percent, he said. In the 1980s, they rose 45 percent. In this latest boom, prices have increased 85 percent.

"A bubble is when the market price of an asset has no basis in what the rate of return on that asset is going to be … when the fundamentals say one thing and the market says another," he said.


Caveat Emptor!
Grim

Running on Debt

From Yahoo Finance:

Americans' Debt: Worse Than You Think?

Highlights:

You've probably heard that the American savings rate for 2005 was negative 0.5 percent, the lowest since the Great Depression. The annual savings rate has been negative only twice -- in 1932 and 1933, during the Great Depression.

...

According to Kasriel's calculation, last year Americans spent approximately $472 billion more than they earned after taxes -- a negative savings rate of 5.2 percent. That spending is double the previous year -- and a record high.

Going back to 1929, Kasriel found just a dozen years in which households spent more than they earned by his calculation. Two were during the Great Depression. Three were in the decade following World War II, when consumers unleashed pent-up savings accumulated during the war (when there was little available to consume). The other seven years of negative savings have occurred since 1999.

...

Mostly, we can't help wondering if the lending and spending free-for-all of recent history will end badly -- for all of us. Imagine interest rates continuing to rise amid an employment downturn. The option ARM holders and other over-leveraged consumers put their homes on the market, or hand the keys to their lenders. The housing market experiences a sharp decline. Commercial banks, Fannie Mae, and Freddie Mac require a taxpayer bailout (a la the early 1990s) -- increasing either the current or future tax liability.

---

Take a look, most certainly worth your time.

Caveat Emptor!
Grim

Canaries of Real Estate?

The NY Times has a new piece on Condo speculation today:

Farewell, Condo Cash-Outs

Over the last few years, real estate speculators looking to make a quick gain also snapped up preconstruction condos in Chicago, Miami and San Diego. With prices rising by more than 20 percent a year, short-term buyers figured that by the time the condos were ready to occupy, they could sell them without ever moving in, clearing thousands of dollars in profits.

But as more speculators look to cash out in recently hot condo markets around the country, some economists say they could put even more downward pressure on prices in those buildings where for-sale listings are swelling. In Miami, at the Jade Residences at Brickell Bay, more than 20 percent of the building's 352 units are on the market. In San Diego, about a third of the 96 units in the Alicante, a condominium that opened last fall, are listed for sale and sellers are already starting to cut asking prices.

In Donald Trump's luxury condos at 120 Riverside Boulevard in Manhattan, owners of more than one-fifth of the building's 250 units are currently marketing their apartments. With so much inventory, said Ilan Bracha, a broker with Prudential Douglas Elliman in New York, "the buyers are coming in, checking the best views and then they negotiate. This is the reality."
...
As those speculators flood the market, he said, they will put pressure on other sellers to cut prices, too. "A rising or sinking tide affects all boats," Mr. Nordby said.

Still, a sell-off in speculative condos is unlikely to start a widespread housing crash, because condos were more overbuilt than single-family homes during the recent boom, said Joseph Gyourko, professor of real estate and finance at the Wharton School of the University of Pennsylvania. But weakness in the condo market, he said, "is a consistent indicator that the great boom has really ended."

----

It's been said that the condo market represents the proverbial canary-in-the-coal-mine for the residential real estate market. Looking back in history it seems that weakness in the condo markets in Boston and the NY Metro area foreshadowed the decline of the housing markets shortly thereafter.

What do you think?

Thursday, February 16, 2006

Slippery Starts and Conflicting Data

You may have heard the news on housing starts and permits today, or maybe you haven't. The news is housing starts and permits were up, but not only up, they were "through the roof" and "explosive".

Housing Starts Explode

January Census Dept Report (PDF)

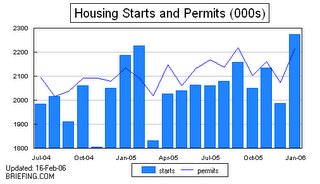
What gives? Everyone said the slowdown was on, and now the starts and permits numbers look like they are breaking records? Who do you believe? My advice is to look at the data and numbers yourself, and draw your own opinions. Take a look at this chart (From Briefing.com):

It should be obvious that it's easy to spin this data, it's incredibly volatile. In November '04 the housing market 'crashed'. In January '05 it 'rallied' back, and then 'tumbled' in March, then 'skyrocketed' in April. I'm sure you get the idea. The number goes up, the number goes down.

So what happened in January? Maybe it was just volatility, maybe it was the weather, maybe it was a number of things. But here is something to keep in mind when thinking about big builders and housing starts. My opinion on the issue is a bit complicated, and it has to do with contracts. In the past few weeks, Toll Brothers, KB Homes, and some other large builders reported an increase in the number of cancelled contracts. Many of these contracts are nonbinding, the buyer can just walk away scott-free, others would forfeit the deposit, but walking away is still an option. These contracts represent a significant portion of their revenues for the upcoming year as the large builders are currently running heavy backlogs. Builders realize consumer sentiment is changing, they see it in the sales numbers, they see it in the existing homes inventory numbers. So what do you do? You've purchased the land, you've got the manpower and equipment to do it, so you do it. You build like hell.


KB Home Warns Home-Order Cancellations Up

Home said the number of canceled home orders rose in the first two months of the year while net orders for new homes fell -- a trend that could force the company to adjust revenue projections if it continues.

Toll Orders Fall As Luxury Home Demand Slows

Toll said the cancellation rate rose to 8.8% in the quarter. He said a big chunk of the cancellations came from the company's Las Vegas market, where the company's delivery time significantly increased, prompting the company to offer buyers the opportunity to cancel. Also, he said some buyers had a difficult time selling their old homes, causing them to cancel their new home order.

Caveat Emptor!
Grim

Risky Loans, Down Payments, and Skin in the Game

Great article in the Voice of San Diego today by Rich Toscano of Piggington fame.

The article focuses on some SD statistics, but is almost universally applicable.

No Skin in the Game

Here are some highlights:

Not so long ago, it was very much standard practice to make a down payment of at least 20 percent when purchasing a home.

But those days are behind us. Thanks to "piggyback loans" and other financial innovations, home buyers are effectively able to make whatever down payment they choose. Often -- by which I mean, very often -- buyers choose not to make a down payment at all.

The extensive use of zero-down mortgages may be a convenience for many homebuyers, but it puts the local housing market at substantial risk.

This is not necessarily a bad thing unto itself. There is, after all, nothing sacred about 20 percent down payments. But given that home prices in many areas of San Diego have been fairly flat over the past 12 months, many buyers who made no down payment still owe around 100 percent on their homes. That's a lot of people with no substantial equity to speak of. And to this number, we can add the immeasurable hordes who have utilized cash-out mortgage refinancings or home equity lines of credit (HELOCs) to drain their homes of equity.

All in all, a significant amount of homeowners effectively owe 100 percent on their homes. And that's a problem, because none of these people have "skin in the game."

In the down-payment days, home owners were encouraged to weather whatever financial storms they could in order to hang onto their houses. To do otherwise would result in the loss of their down payments and all the equity they'd accrued over the years.

Now, between zero-down loans, cash-out refinancing, and HELOCs, there are a lot of home owners out there who don't have any such incentive. They have very little invested in their homes. If any of these homeowners run into financial trouble, they will, unlike the 20 percent down-payer of old, have little reason to stick around.

...

Zero-down mortgages sure have made for a fun housing market over the past few years. But they also make for a dangerous combination with looming mortgage payment shocks and housing-related job loss. There are too many players with no skin in the game, and should times get tough, some of those players could send things from bad to worse.

Caveat Emptor!
Grim

Star-Ledger Comments On Median Home Price Survey

From today's Star-Ledger:

Recent home-price report has ups, downs
by Sam Ali

Quarterly survey has fuel for optimists, pessimists

For the "glass is half full" crowd, the quarterly, home-price report released yesterday by the National Association of Realtors was impressive.
...
On the other hand, the "glass is half empty" crowd had plenty of ammunition, too.

Median home prices in many regions fell when compared with the previous quarter. On a seasonally adjusted basis, the median home price in the Northeast declined 3 percent, to $243,150 in the fourth quarter from $246,640 in the third quarter, said Celia Chen, director of housing economics at Economy.com, a research company in West Chester, Pa.

Seasonally adjusted prices? Sorry, those numbers just don't illustrate anything Sam. The Median Sales Price in the Northeast fell to $240,300 in the fourth quarter, a drop of 3.6%. The fourth quarter Northeast numbers also fell below the first, second, and third quarter numbers, so while prices were up year over year, they were down for the year.

"I've been saying all along there isn't a housing bubble and that the market will ease but it will stay healthy," said Dominick Prevete, regional vice president for northern New Jersey at Morris Plains-based Weichert Realtors. "But I think those people who have been beating their chests about the housing bubble bursting will find something in this report to say 'Ah-ha, it's happening!'"

Are you serious Dominick, "those people who have been beating their chests"? Who are they? Is it the first time homebuyer that is planning on taking out a risky neg-am I/O loan to afford a home? Is it the homeowner that has been convinced to buy an investment property in Florida? The person that took out a mortgage on their home to buy a home at the shore, all the while knowing they can't really afford it. Is this some kind of you-versus-them game Dominick? These are real people here, these are real lives. You seem to put very little stock in the fact that it's very possible that many lives will be ruined here Dominick, many lives. And you know what Dom, I've already showed the precident for it, the 1980's bubble and burst. I suppose that was the past, and this time is different.. Right?

Dominick, you give no basis for your outlook, yet you continue to peddle it. Your argument is as follows: "Real estate did well in the past, thus, it must continue to do so." Sorry, but past performance does not guarantee future results. When this is finally over we will see national legislation barring real estate brokers and agents from making predictions or promises of future appreciation. Do you think Dominick reads this blog? I do.

Nationally, existing home sales, which include single family home and condos, rose an ever-so-slight slight 0.3 percent compared with last year. And if you dig a bit deeper, fourth-quarter sales in the Northeast actually declined 2.7 percent and an even bigger, 7.7 percent in New Jersey, year over year, the report said.

I thought prices never declined?

"Sales are slowing and it is taking longer for people to move their homes," Chen said.

Everyone is seeing the same slowdown here in New Jersey.

Still, Ken Baris, president of Jordan Baris in West Orange, said he remains an optimist about the residential real estate market in northern New Jersey.

"All along, we have gone out on a limb and we have been saying we don't believe we are in a bubble," Baris said. "At this point, we have seen one of the most incredible runs, maybe in real estate history, and the market has been extraordinary. Is it slowing a bit? Yes, but we don't see the bottom falling out."

We're all out on limbs here Ken, So state your reasons and back it with something tangible, not opinion.

The strongest gains in the region could be found in the New York City-Wayne-White Plains area of New York and New Jersey, where the median price of a home soared 19.2 percent, to $537,300.

Can't argue with that, data shows a peak in Q4.

In the Edison area, a four- county span that includes Middlesex, Monmouth, Ocean and Somerset counties, the median home price rose 11.9 percent, to $384,600 compared with a year earlier.

Edison hit a peak of 394.1 in the second quarter and has been declining over the second half of the year.

Home prices in the Newark metropolitan region -- a five- county span that includes Essex, Union, Morris, Warren and Sussex -- rose 14.5 percent, to $427,600.

Newark metropolitan region hit a peak of $446.8 in the third quarter, declining 4.5% in the fourth.

Caveat Emptor!
Grim

Wednesday, February 15, 2006

Weekly Mortgage Rates Increase

Mortgage rates on the rise again. Treasury yields pushed higher yet this week, likely putting further pressure on mortgage rates to increase next week as well..

Weekly Home Mortgage Rates

30-Year Fixed
Feb. 15 Prev. Wk percent+points
New York 6.34 + 0.23 6.28 + 0.18
National Avg 6.37 + 0.37 6.32 + 0.35

5-Year Adjustable
Average 6.05 +0.40 5.99 +0.37

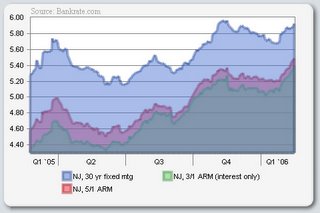
With changes up and down each week, it's hard to understand where rates are today in relation to a year ago. Nothing a chart won't help illustrate:


It should be obvious that the benefit of using a 5/1 ARM or 3/1 IO ARM has significantly decreased in the first quarter of 2006. Also notice how the spread between these mortgages has narrowed over the past year, a result of increased short term rates without a corresponding increase at the long end.

Increased rates on the ARM and I/O mortgages will undoubtedly have a negative impact on first quarter '06 sales in Northern NJ.

Caveat Emptor!
Grim

New Jersey Fourth Quarter Median Home Prices

The NAR released their 2005 Q4 median home price data today:

Median Sales Price of Existing Single-Family Homes

as well as the following press release:

HOME-PRICE APPRECIATION STAYS HOT ACROSS COUNTRY

NorthEast
2005:I 246.2
2005:II 243.1
2005:III 249.2
2005:IV 240.3

Atlantic City, NJ
2005:I 217.4
2005:II 244.9
2005:III 247.6
2005:IV N/A

New York-Northern New Jersey-Long Island, NY-NJ-PA
2005:I 412.5
2005:II 452.7
2005:III 461.1
2005:IV 459.6

New York-Wayne-White Plains, NY-NJ
2005:I 456.6
2005:II 506.8
2005:III 533.6
2005:IV 537.3

NY: Edison, NJ
2005:I 343.1
2005:II 394.1
2005:III 386.9
2005:IV 384.6

NY: Newark-Union, NJ-PA
2005:I 380.4
2005:II 414.4
2005:III 446.8
2005:IV 427.6

Trenton-Ewing, NJ
2005:I 225.4
2005:II 264.3
2005:III 290.5
2005:IV 243.1

Caveat Emptor!
Grim

Northern NJ Weekly Residential Inventory Update

GSMLS
Single Family, Condo, Coop
(Bergen, Essex, Hudson, Morris, Passaic, Somerset, Sussex, Union, Warren Counties)
2/8 - 12,233
2/15 - 12,376 (1.2% Increase)

NJMLS
Single Family, Condo, Coop
(Bergen, Essex, Hudson, Passaic Counties)
2/8 - 5,865
2/15 - 5,960 (1.6% Increase)

MLSGuide
Single Family, Condo, Coop
(Hudson County)
2/8 - 1,990
2/15 - 2,054 (3.2% Increase)

Inventory stats will be posted every week, prior to noon on Wednesday. The numbers will include all 3 of the Northern NJ MLS systems, GSMLS, NJMLS, and the Hudson MLS. If someone would like to provide me with numbers from the FSBO systems, I'll gladly include them as well. These numbers do not include multifamily homes, only SFH, Condos and Coops. Realize that this does make an impact in certain areas of North Jersey with high densities of multifamily (Hudson, Passaic, etc).

Mortgage Rates Up, Applications Down

MBA: Mortgage applications down last week

Index measuring home loan activity drops to its lowest level in two years, industry group says; third consecutive weekly decline.

Mortgage applications fell for a third consecutive week as demand for loans to purchase homes dropped to its lowest level in more than two years, an industry trade group said Wednesday.

The Mortgage Bankers Association said its seasonally adjusted index of mortgage application activity for the week ended Feb. 10 decreased to 574.1, down 7.3 percent from the previous week's 619.3.

The MBA's seasonally adjusted purchase mortgage index, which is considered a timely gauge on home sales, fell 7.9 percent to 391.7 from the previous week's 425.1, its lowest level since the week ended Dec. 26, 2003, when it hit 390.1.

...

The 30-year fixed-rate mortgage, the industry benchmark, is substantially above its 2005 low of 5.47 percent in late June of 2005, but hovering below its 6.33 percent high in the week of Nov. 11, 2005.

Fixed 15-year mortgage rates averaged 5.92 percent, up from 5.84 percent the previous week. Rates on one-year adjustable-rate mortgages (ARMs) increased to 5.52 from 5.48 percent, further narrowing the distance between rates on the ARMs and the fixed-rate mortgage loan.


(emphasis added)

Caveat Emptor,
Grim

Tuesday, February 14, 2006

Homeownership Propaganda Machine Running Full Steam Ahead

Looking for contrarian indicators of the housing bubble collapsing? Well here you go:

Why Homeowners Get Rich and Renters Stay Poor

Seems Wells Fargo has schemed up a new idea to bring in the next round of greater fools, and they've done it in grand style with "The Great American Homeowner Challenge".

If that title alone doesn't make you want to show your patriotic pride and go buy a home, I don't know what else would..

From 2001 to 2005, the average homeowner saw the value of his or her house jump by more than 50%. Many homeowners doubled, tripled, and in some cases even quadrupled their wealth in just five years because of exploding real estate values.

Imagine that. Buy a home, live in it, build your wealth, get great tax deductions -- and then retire rich. It may sound too good to be true.

Indeed, plenty of experts will tell you that the housing boom never happened. According to them, what we've experienced over the last few years was just a "bubble" that's going to pop any minute now. Others insist that whether it was a boom or a bubble, it's over. According to them, it's now too late to get in on the party.

It's a bit early in the morning for me to pick apart this piece sentence by sentence, so I'll leave it up to all the readers to do it. Let the comments begin!

NJ Home Seller Finds Creative Way To Skirt Sign Restrictions

Ever wonder why some developments seem to be overflowing with For Sale signs, while others seem to be devoid of them? Well, it's because some homeowner associations do not allow homeowners to post for sale signs to advertise their homes. This New Jersey couple found a creative way to skirt around the rules.

Banner day for home rule

Planting a "For Sale" sign on the front lawn is one of the first things people do when they decide to sell their homes. It's practically the American way.

But Joan and Kenneth Tencza, who live in the Locust Hill adult community in Hamilton, can't. Their homeowners association won't allow it.

So after receiving two threatening letters from the association's management company -- one for posting a "For Sale" sign in their front window and another for a sign they put on Yardville-Hamilton Square Road, just outside the entrance to the development -- the couple has found an innovative way around the rules.

They've hung a festive red and white flag outside their home to let people know the house is on the market.

"The rule is no signs, but decorative flags are allowed. So I put up a decorative flag," Joan Tencza said with a grin.

The white and red homemade flag says "For Sale by Owner" and has the couple's telephone number, along with a large heart with an arrow through it.

...

Cupit, president of the Locust Hill homeowners association, declined to talk about why the sign ban is in place and referred calls to the organization's management company, P&A Management Inc.

P&A President Al Pellegrino said the restrictions on "For Sale" signs generally start with builders of the developments, who do not want competition when they are trying to sell homes. The restrictions are then retained by the homeowners associations.

Sellers that decide to sell FSBO have a significant disadvantage in these communities. Without MLS exposure, it's almost impossible to get any exposure to your home.

Caveat Emptor!
Grim

Monday, February 13, 2006

Barrons looks at the lending side of the real estate bubble

Barrons takes a good look at the changes in lending that fed the real estate mania, and in my opinion, will be a factor the feeds the demise of it.

Coming Home to Roost

THE RED-HOT U.S. HOUSING MARKET MAY be fast approaching its date with destiny. Indeed, inside the mortgage trade, much anxiety is being focused on a looming "reset problem." Over the next two years, monthly payments on an estimated $600 billion of mortgages to borrowers with checkered or no credit histories -- the "sub-prime" market -- may zoom as much as 50% higher, as the two-year teaser rates on hybrid adjustable-rate loans expire and interest payments hit their fully indexed levels.

In the past, such resets caused little disruption. For one thing, the sub-prime market was strikingly smaller. Only $97 billion of such mortgages were originated in 1996, compared with a mammoth $628 billion last year and $540 billion in 2004, according to the trade publication Inside B&C Lending. Sub-prime loans outstanding now account for more than 10% of the total U.S. mortgage debt of $8.4 trillion.

Moreover, the reset triggers on sub-prime mortgages have dramatically shortened, with the loosening in underwriting standards. During the past two years, "affordability" products, as the industry has dubbed them, have migrated from prime to sub-prime borrowers.
...
Surging property values in much of the country in the past four years helped bail out many sub-prime borrowers, letting them refinance their loans as painful resets loomed. Many borrowers not only refinanced old debt at attractive teaser rates, but also sucked additional equity out of their homes with cash-out refinancings, to pay off higher-rate credit-card debt. Meanwhile, delinquency rates and credit losses remained artificially low. A tapped-out borrower always could sell his home into a soaring real-estate market to pay off his mortgage debt and regroup.

But now the refi window may be closing for the sub-prime crowd. The Fed's hikes in short-term interest rates have pushed up fully indexed ARM rates. At the same time, evidence is mounting that home-price appreciation is slowing or, in a few areas, reversing. And the secondary market in mortgage-backed securities, which provides some 90% of the liquidity in the sub-prime market, is starting to balk at the easy lending practices in this sector.

Various doomsday scenarios are being posited. A New York hedge-fund manager heavily playing the short side of sub-prime mortgage securities foresees a coming spiral in delinquencies, foreclosures and credit losses from tapped-out sub-prime borrowers facing monthly payments they can't meet. A deadly feedback loop impends in which forced home sales will diminish collateral values, which, in turn, will foster yet more delinquencies and forced sales. Before the crisis runs its course, the deflationary contagion will infect all manner of homes, from high-end to starters, says this bear.

Caveat Emptor,
Grim

Sunday, February 12, 2006

Price Reduced! 1/29 - 2/12

Welcome to another edition of Price Reduced!

For all the newcomers to this blog, Price Reduced! takes a look at a handful of significant price reductions across Northern NJ. The purpose of this exercise is to serve as proof that the Northern New Jersey real estate market has long since been overvalued and has started the long hard decline back to the mean.

These listings are in no way an endorsement by myself, nor do I believe they are a bargain or a value. Even reduced, I still believe these homes are still grossly overpriced.

With that, the listings please!

MLS# 2231371 - Hamburg, NJ
Previous Price $488,900
Current Price $388,900 (Price Reduced 20.5%)

MLS# 2219478 - Newark, NJ
Previous Price $224,900
Current Price $185,000 (Price Reduced 17.7%)

MLS# 2206673 - West Milford, NJ
Previous Price $1,190,000
Current Price $995,000 (Price Reduced 16.4%)

MLS# 2216603 - Kinnelon, NJ
Previous Price $797,000
Current Price $670,000 (Price Reduced 15.9%)

MLS# 2232513 - Bloomfield, NJ
Previous Price $587,500
Current Price $499,000 (Price Reduced 15.1%)

MLS# 2233936 - Montclair, NJ
Previous Price $1,695,000
Current Price $1,450,000 (Price Reduced 14.5%)

MLS# 2240103 - Scotch Plains, NJ
Previous Price $599,900
Current Price $515,000 (Price Reduced 14.2%)

MLS# 2222745 - Newton, NJ
Previous Price $389,900
Current Price $334,900 (Price Reduced 14.1%)

MLS# 2202084 - Montville, NJ
Previous Price $1,525,000 (Increased from OLP of $1,349,000)
Current Price $1,315,000 (Price Reduced 13.8%)

MLS# 2103593 - Mount Olive, NJ
Previous Price $289,900 (Reduced from $320,000)
Current Price $250,000 (Price Reduced 13.8%, 21.8% off OLP)

MLS# 2232784 - Elizabeth, NJ
Previous Price $220,000
Current Price $189,900 (Price Reduced 13.7%)

MLS# 2065407 - Millburn, NJ
Previous Price $2,895,000 (Reduced from $2,995,000)
Current Price $2,499,000 (Price Reduced $13.7%)

MLS# 2206230 - Union, NJ
Previous Price $299,999
Current Price $260,000 (Price Reduced 13.3%)

MLS# 2210539 - West Milford, NJ
Previous Price $1,150,000 (Reduced from $1,200,000)
Current Price $999,900 (Price Reduced 13.1%, 16.7% off OLP)

MLS# 2207980 - Somerville, NJ
Previous Price $789,000
Current Price $692,000 (Price Reduced 12.3%)

MLS# 2205109 - Hanover, NJ
Previous Price $569,900 (Reduced from $585,000)
Current Price $499,900 (Price Reduced 12.3%, 14.5% off OLP)

MLS# 2224108 - Parsippany, NJ
Previous Price $495,000
Current Price $435,000 (Price Reduced 12.1%)

MLS# 2204401 - Old Tappan, NJ
Previous Price $1,350,000
Current Price $1,195,000 (Price Reduced 11.5%)

MLS# 2226156 - Livingston, NJ
Previous Price $959,000 (Reduced from $1,059,000)
Current Price $849,000 (Price Reduced 11.5%, 19.8% off OLP)

Over the two week period covering 1/29 - 2/12, the prices on 1175 homes were reduced. The average reduction was 4% and the total dollar reduction was almost $26 million dollars.

Caveat Emptor!
Grim