Saturday, November 19, 2005

Lowball! 11/13 - 11/19

Welcome to another edition of Lowball!

Lowball! takes a look at home sales over the past week from a very different perspective. For those new to Lowball!, a lowball offer is when a buyer offers a significantly lower bid than asking in hopes that the seller accepts the offer. We take a list of home sales over the past week and pick out the sales that have the highest percentage difference between asking price and selling price.

The reason for Lowball! is to show buyers that the market has changed and buyers now have considerably more leverage than sellers. Just a short time ago, lowball offers would have been laughed at and discarded, however, not any more. The fact that so many under-asking offers are being accepted is clear proof that the market is changing.

The list does not contain all sales, I hand-pick the most interesting sales from the list. These listings might be the highest dollar drops, biggest percentage reductions, or sales in towns that are thought to still be 'hot'. Please note, even with double digit percentage reductions, these homes are still incredibly overpriced.

This week's list of Lowball! sales is very interesting, and I'll tell you why. The first 6 listings were all lowball offers greater than 20% off the asking price, the lowball offers are getting deeper, and sellers are accepting. More then 75% of all sales over this period were Lowball! offers, that's right folks, out of some 590 sales I looked at on GSMLS, over 75% were offers under asking.

MLS# 2079066 - Vernon, NJ
Asking Price $169,900
Selling Price $120,000 (41.6% Lowball)

MLS# 2089089 - Madison, NJ
Asking Price $2,890,000
Selling Price $2,300,000 (25.7% Lowball)

MLS# 2088167 - Frelinghuysen, NJ
Asking Price $562,000
Selling Price $450,000 (24.9% Lowball)

MLS# 2089581 - Hoptatcong, NJ
Asking Price $205,000
Selling Price $165,000 (24.2% Lowball)

MLS# 2096901 - Hawthorne, NJ
Asking Price $429,900 (Originally $459,900)
Selling Price $350,000 (22.8% Lowball)
(Very interesting historic brownstone, built in the 1810's.)

MLS# 2093225 - Linden, NJ
Asking Price $459,900 (Originally $460,000)
Selling Price $375,000 (22.6% Lowball)

MLS# 2089944 - Pequannock, NJ
Asking Price $449,900
Selling Price $387,000 (16% Lowball)

MLS# 2074275 - Mahwah, NJ
Asking Price $999,900 (Originally Asking $1,099,000)
Selling Price $875,000 (14.3% Lowball, 20.4% from OLP)

MLS# 2103134 - Westfield, NJ
Asking Price $1,595,000
Selling Price $1,415,000 (12.7% Lowball)

MLS# 2068740 - Millburn, NJ
Asking Price $899,000 (Originally Asking $950,000)
Selling Price $ 800,000 (12.4% Lowball, 15.8% from OLP)

MLS# 2072601 - Boonton, NJ
Asking Price $619,000
Selling Price $555,000 (11.5% Lowball)

Biggest Dollar Lowball!

Peapack Gladstone, NJ (I will not post the MLS# of this one)
Asking Price $12,500,000 (Originally Asking $13,900,000)
Selling Price $11,500,000 ($1m off Asking, 2.4m off OLP)

A few closing notes, keep in mind this data is from GSMLS, not Hudson or NJMLS, thus this data neglects Lowball! offers through other systems. For example, Bergen listings are primarily on the NJMLS, so they often don't get their fair share as part of these listings. However, on the subject of Bergen, I always keep a close eye on Ridgewood, I feel it to be a good indicator of Bergen trends. So let me just throw one Bergen MLS drop out for the team..

MLS# 2074326 - Ridgewood, NJ
Asking Price $549,900 (Originally Asking $575,000)
Selling Price $520,000 (5.8% Lowball, 9.6% off OLP)

Caveat Emptor!
Grim

Friday, November 18, 2005

An Agent's View Of The Bubble

It's always interesting to go through the articles and stories on Inman news or RealtyTimes to get an industry perspective on the bubble. I'd usually browse through the Inman topics once or twice a week looking for a juicy story, but most everything was the typical anti-bubble propoganda. Boy how things have changed! Most every article is about covering your backside.

Let's take a look at one very recent piece on RealtyTimes

San Diego Real Estate -- A Trend to Go National?

---
The grand opening long buyer lines, multiple offers, offers above the asking price and homes selling within days of being listed are just fond memories now. However, due to the huge home appreciation all San Diego real estate has seen, with the average home up 100 percent in the past 5 years, combined with the boom in 100 percent adjustable/interest only loans, the stage is set for what is sure to be mind-numbing depreciation.


...

So, sure it's great to be optimistic about your real estate market place, but ignoring the obvious trends will cost you in both money and reputation. It was about five years ago that the mantra was that this was a new paradigm and the stock market no longer followed the old rules of valuation. We were soon to reach Dow 20,000! Hopefully, you missed that costly over-enthusiasm. The result was such a drop that five years later we finally may be building a base.

...

Yes, we have started on the down leg of the typical 'Bell Curve' and the probability of surpassing our approximate 20 percent drop in San Diego home values experienced from 1990 through 1996, seems assured. Plus, as real estate trends seem to start in the West and then move east, any U.S. real estate market that experienced huge price appreciation the past five years, will experience the same depreciation in real estate residential values.
----

Most certainly very surprising words considering these were published on a real estate news website. And yes, you read those words right, "the probability of surpassing our approximate 20 percent drop in San Diego home values experienced from 1990 through 1996, seems assured...any U.S. real estate market that experienced huge price appreciation the past five years, will experience the same depreciation in real estate residential values."

Batten down the hatches folks, there is one heck of a storm brewing.

Caveat Emptor!
Grim

Looking Back At Expert Opinions

The site I'm about to talk about has been making it's way around the web and around blogs for a while now. If you've seen it, sorry for the duplication, if not, it's worthwhile reading.

Chart of Pompous Prognosticators

The site takes a rather novel look at The Great Crash of 1929. A play-by-play look of what industry experts, politicians, and academics were saying during the spectacular rise in the Dow Jones Industrial and through the subsequent (and most spectacular) crash. Take a good look at those names, don't they sound awfully familiar? How did these experts and academics get it 'so wrong'?

Take a good look at the comments on the way up. No, I'm serious, take the time to take a look at that site and read it. If you don't know who Keynes, Irving Fisher, and the others were, read up on them in Wikipedia. Don't just skim over this and say "It's different this time" or "The stock market and housing have nothing in common." This has nothing to do with housing or the stock market, but how expert, professional, political, and academic opinion isn't always the best source of information.

It's eerie how similar the situation is if you overlay those names with the housing shills of today. I can see the website in my head already.

"We will not have any more crashes in our time."
- John Maynard Keynes in 1927

"There is no national housing bubble."
-David Lereah in 2005

Caveat Emptor,
Grim

Thursday, November 17, 2005

Housing Experts Change Their Tune

Just came across this piece by Seth Jayson over at Motley Fool. He seems to have a pretty good grasp on the housing bubble. I'm going to say this is another must read article. I'm just going to cut a few choice snippets out to tease you into clicking that link.

Housing Experts Change Their Tune

Shhh ... just listen ...It was only a few weeks back that I suggested home shoppers not believe everything they hear from the oft-quoted, so-called Experts regarding the housing market. There was a pretty straightforward reason. Despite much evidence to the contrary, the people with a vested interest in continuing to see prices rise -- like the outgoing Fed chief, Alan Greenspan -- kept telling the soundbite-seeking press that there was no "bubble."

...

And now it's time to ... Change! That! Tune! What a difference a few weeks can make.

...

Even Booger Bob -- the kid who picks his ear with the sharp end of his mechanical pencil and wipes the residue on the soles of his shoes -- even ear-pickin', wax-flickin' Booger Bob could have told you that once the interest rates creep upward, and/or real wages stagnate, and/or "core inflation" begins to bite buyers in the tuckus, putting a lid on monthly "affordability," the only variable left to move, if you want that home to move, is the home price itself. And it's gotta move down, eventually. And if it doesn't move down, well, people stop buying, right?

(I nearly spit out my coffee when I read this part -grim)
...

Maybe we should ask the experts at the Fed, or the National Association of Realtors, and everywhere else, "Just what is it that happens to home prices when the free money becomes less free, and that panicky run to 'get into the market, no matter what it costs,' comes grinding to a halt?" "What happens when the 'wealth of housing returns' goes flat, or even negative?" "Will housing continue 'stimulating the economy?' "

But maybe the final question should be, "Why didn't you talk more about this a few months ago?"

See, I think it is just because we just don't understand expert terminology. The first part is tiny bubblettes forming around the country, those bubblettes turned into regional froth. See, froth, not bubbles. But then someone came in with balloons, but I'm not so sure what those are, I can't seem to find that described in an economics textbook. Until only just recently did a bubble form, but it's OK, because prices only go up.

Caveat Emptor,
Grim

Housing Starts and Permits Tumble

Both Housing Starts and Building declined dramatically in October stated a new report released by the Commerce Deparment early this morning.

New Residential Construction In October 2005

Within a matter of minutes the news spread across the news wires.

Housing starts drop

U.S. housing starts fell 5.6 percent in October as construction of both single-family and multifamily homes slid, while a drop in permits for future groundbreaking was the largest in more than six years, the government said on Thursday.

October housing starts declined to a 2.014 million unit annual rate, slower than the 2.070 million unit pace expected by Wall Street economists, who had anticipated rising mortgage rates would cool activity. The decrease in October starts, from an upwardly revised 2.134 million unit rate in September, was the largest percentage drop since March.

...

Permits for future groundbreaking, an indicator of builder confidence, declined to a 2.071 million unit pace. That was down 6.7 percent from September, the biggest percentage decline since September 1999, when permits fell 7.2 percent, the Commerce Department said.

It said recent Gulf Coast hurricanes had minimal impact on the data.

Housing starts slow

The Census Bureau report showed that housing starts in October came in at an annual pace of 2.01 million, down from the revised 2.13 million pace in September. Economists surveyed by Briefing.com had forecast that starts would slip to an annual rate of 2.06 million.

Building permits, which are seen as a measure of builders' view of market strength, dropped to an annual rate of 2.07 million from 2.22 million in September. Economists had forecast permits would fall to a 2.17 million annual pace.

I'm sure the NAR will call this "a normal seasonal slowdown".

Caveat Emptor,
Grim

Mortgage Rates Pause

Mortgage rates are taking a pause this week after a nine straight weeks of pushing higher. The 30Y rate remained stable at 6.42, the 15Y rate moved upwards 3 basis points to 5.99, and the 5Y ARM dropped only a single point to 5.93.

Weekly Home Mortgage Rates

The MBA Purchase Mortgage Index did rise 2.6% to 477.9 last week. Refinancing continues to fall out of favor as rates are rising, the refinancing index dropped 5.4%. The overall mortgage activity index dropped 0.6%.

High rates reduce mortgage applications

Caveat Emptor,
Grim

Wednesday, November 16, 2005

Weekly Inventory Update

Time again for the weekly inventory update, however, not much in the way of news from my viewpoint, actually eerily quiet. I'll be looking through data to see if I can start tracking withdrawl and expired listing data to see if I can get a better gauge of the market. Sorry this is being posted a bit later than usual, I wasn't able to get this up at the usual time.

GSMLS
(Bergen, Essex, Hudson, Morris, Passaic, Somerset, Sussex, Union, Warren)
11/9 - 12832
11/15 - 12833 (Flat)

NJMLS
(Bergen, Essex, Hudson, Passaic)
11/9 - 5796
11/15 - 5801 (Flat)

Hudson MLS
11/9 - 1769
11/15 - 1764 (Flat)

Caveat Emptor,
Grim

N.J. home sale fever breaking, data show

Another Real Estate article in the Star Ledger today, this time by staff writer Sam Ali.

N.J. home sale fever breaking, data show

Sometimes the numbers don't tell the whole story, housing experts said yesterday after glancing at home price and sales statistics from the National Association of Realtors.

At first blush, everything seems rock-solid: The national median price of a single-family home -- the point at which half sold for more and half sold for less -- rose a healthy 14.7 percent to $215,900 for the third quarter, compared with$188,200 in the same period a year ago.

Unfortunately, for folks like Joe Natale, a mortgage banker and builder based in Cranford, the NAR's third-quarter numbers are a bit stale.

"We're already in November, the middle of the fourth quarter, so those numbers are already yesterday's news," said Natale, president of First United Mortgage and JDN Properties. "Today the world is a very different place."

Like we all said yesterday, we knew the Q3 numbers were high, we saw it first hand, however, it didn't stop the media and the NAR from trying to spin the data to make it look as if we didn't just go off a cliff.

"I believe the NAR numbers don't reflect the last 45 to 60 days in the market," said Dominick Prevete, regional vice president for northern New Jersey at Morris Plains-based Weichert Realtors. "In the short term, buyers have been on hold by some recent developments, like the Hurricane Katrina and the quick run-up in energy prices. Those things had people scared and a bit frozen."

It's our old friend Dominick Prevete again. You might remember him from "Debunking Another Real Estate Puff Piece", a few weeks ago, I think I may have called him a skirt wearing, pom-pom shaking cheerleader for saying the market was a "win-win for buyers and sellers" and recommending risky loans. It seems he's changed his tune a bit, so I wonder if he read my article (I did see alot of hits from Google showing that folks hit my site searching for his name).

Again, however, I must call you a moron Mr. Prevete. What impact would the hurricanes have on buyers in New Jersey? In case you missed it, they didn't exactly hit here. Or are you just looking for something to blame, calling it only a short term downturn once we get over the pain of the hurricanes? And run up in energy prices? If the recent uptick in energy prices made it hard on someone to purchase a home, I really don't think those people should be buying a home in the first place. These prospective buyers must be pretty strapped for cash if you are blaming an increase in gasoline prices on the decrease in sales. No Mr. Prevete, the reason people aren't buying is because more and more people realize that real estate isn't a "win-win" investment, and you can lose alot of your hard earned money. Buyers know we are in a bubble, and they are smart enough not to buy.

What will happen to the market when buyers realize they have the power to control prices?

Caveat Emptor,
Grim

Core CPI Up 0.2%

Core CPI increased 0.2% in October, in line with consensus estimates of 0.2%, CPI also increased at 0.2%, above consensus estimates of 0%. This marks the largest increase in the core numbers in more than six months. Not surprisingly, Housing ticked in at a 0.9% increase, a jump not seen in some time.

Consumer prices up unexpectedly

U.S. consumer prices unexpectedly rose 0.2 percent in October despite a dip in energy prices as the cost of housing notched the largest increase in nearly five years, a government report showed on Wednesday.

Excluding food and energy costs, prices increased 0.2 percent, the Labor Department said, matching Wall Street expectations.

Economists had expected overall consumer prices to hold flat in October.

For those interested in drilling down into a more detailed report of the CPI data, you can find that here:

Consumer Price Index: October 2005

CPI numbers were up despite energy prices showing the first decline in 4 months and a rather significant decline in transportation. Just more evidence that the Fed must continue to raise rates and remove policy accomodation. Look for further increases out of the FOMC Policy Meetings in December, January, and March.

Caveat Emptor,
Grim

Tuesday, November 15, 2005

Price Reduced!

It's time for yet another episode of Price Reduced! For all the newcomers to this blog, Price Reduced! takes a good look at a handful of significant price reductions across Northern NJ. The purpose of this exercise is to serve as proof that the Northern New Jersey real estate market has long since been overvalued and has started the long hard decline back to the mean. These listings are in no way an endorsement by myself, nor do I believe they are a bargain or a value. Even reduced, I still believe these homes are still grossly overpriced. With that, the listings please!

Our winner by a longshot this week:

MLS# 2092591 - Mountainside, NJ
Original Price 1,100,000
Reduced Price 775,000 (29.5% Reduction)
(Not sure about this one, could be an error but certainly looks legit)

MLS# 2082700 - Montclair, NJ
Original Price 3,800,000
Reduced Price 2,950,000 (23.4% Reduction)
(This one is listed on the MLS twice, under both Cedar Grove and Montclair)

MLS# 2215549 - Bridgewater, NJ
Original Price 599,990
Reduced Price 459,990

MLS# 2110146 - Rahway, NJ
Original Price 225,000
Reduced Price 179,900 (20% Reduction)

MLS# 2211947 - Hillsborough, NJ
Original Price 564,900
Reduced Price 459,900 (17.7% Reduction)

MLS# 2111356 - Morristown, NJ
Original Price 549,000
Reduced Price 459,900 (16.2% Reduction)

MLS# 2107052 - Westfield, NJ
Original Price 1,750,000
Reduced Price 1,495,000 (14.6% Reduction)

MLS# 2065814 - Peapack, NJ
Original Price 5,500,000 (Originally 7 million dollars)
Reduced Price 4,700,000 (14.6% Reduction)
Listing Link
(If you win the mega millions jackpot tonite, I'd suggest buying this home)

MLS# 2105696 - Madison, NJ
Original Price 699,000
Reduced Price 599,000 (14.3% Reduction)

MLS# 2206532 - Sparta, NJ
Original Price 349,900
Reduced Price 300,000 (14.3% Reduction)

MLS# 2103335 - Clifton, NJ
Original Price 569,000 (Originally 649,000)
Reduced Price 519,000 (13.4% Reduction)

MLS# 2205636 - Montclair, NJ
Original Price 859,000
Reduced Price 749,900 (12.7% Reduction)

If you'd like to look up any of these listings, you can do so by doing an MLS# Search through realtor.com.

Caveat Emptor!
Grim

Third Quarter NAR Data Released

The NAR Released the Q3 Existing Home Sales data today, that data includes both the Median Sales Price and Total Sales for the quarter.

Median Sales Price

Q3 Data was as expected, and realize that Q3 data is a lagging indicator that includes sales from July, August, and September. We're currently in the right in the middle of Q4. In a previous post I called "Top" in September, I believe that fits in with the NAR data released today.

The only MSA covering New Jersey that reported a decline in the Q3 numbers was the Edison, NJ (about a 2% decline) . Other areas showing declines were: Albuquerque, Charleston, Colorado Springs, Decatuar, Dallas-FtWorth, Green Bay, Kankakee, Memphis, Minneapolis-Saint Paul, Pittsfield, Rockford, Sarasota-Bradenton-Venice, Southbend, Souix Falls, and San Francisco-Oakland-Fremont.

Also released were total sales (seasonally adjusted).

Total Sales by State

Again, this was as expected, Q3 is historically the strongest quarter in terms of sales.

If anyone has the Q2 data, I'd love to have a copy, I'm looking to whether the Q2 numbers were revised upwards or downwards for this area.

Thanks,
James

Daily Economic Update

The PPI ratcheted up 0.7% this month, for reference, it jumped 1.9% last month. There is significant inflation pressures on the producer side. The consensus estimate for the PPI was 0% this month. Core PPI was down a bit at-0.3%, I have no faith in the core numbers, simply because they exclude most everything that has been increasing in price. The report shows that there are still significant inflation pressures at the producer level. While much of this cost has not yet been fed down to the consumer level, with increases this significant, there is no doubt that they will. However, realize that the relationship between the PPI and CPI isn't typically a simple one.

U.S. October Producer Prices Rise 0.7%; Core Prices Fall 0.3%

Retail sales came in at about expected levels. Retail sales (ex-Autos) is actually a bit stronger than I expected. Consumer spending is still strong. This leads me to believe that the savings rate will again be negative early next month.

U.S. October Retail Sales Fell 0.1%; Ex-Autos Increase 0.9%

In case you are wondering why we should care? The housing market does not exist in a vacuum, it is driven by consumer sentiment and a host of economic factors. In order to understand the housing market movement, we must also monitor and understand the movement of it's related factors.

Caveat Emptor,
Grim

Monday, November 14, 2005

Real Estate Like The Dot Coms - Jim Cramer

In an interview with CBS 60 minutes yesterday (Mad Money Man Jim Cramer), flip flop man Jim Cramer reneged his love for the real estate bubble.


Always an optimist, he nevertheless believes that the real estate bubble is about to burst.

“I think real estate is very similar right now to what the dotcoms were like in 2000. Everybody thinks you can’t miss with real estate. Actually I shouldn't say that. In the last five months, I think it's starting to dawn on people that real estate can go wrong,” says Cramer.

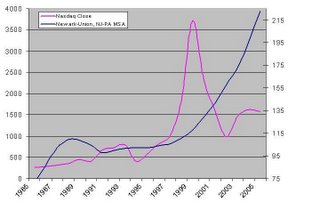
His comment got me wondering, just how similar is the trend seen in the Nasdaq circa 2000 to the housing bubble today? I plotted the closing price of the Nasdaq index from 1985 to 2005 on one scale, on the other I plotted the Newark-Union, NJ-PA MSA house price index data (This is the same dataset RentingInNJ used in a piece a few weeks back).

Please note the scales are adjusted to that the peaks and troughs of the trends fall at similar levels. However, the trends do point to an interesting relationship. How much of our local housing bubble was due to the run up in the Nasdaq beginning in the late 90s? Wages were tremendous in Northern NJ/NYC during the dot com era and many portfolios were bulging at the seams. However, the graph clearly shows (again), how steeply prices have increased in a relatively short period of time.

Caveat Emptor,
James

Economic Calendar

Quite a bit of important economic data is scheduled to be released over the next few days. While most people don't care to know or understand this data, we aren't most people. This data is central to how the Federal Reserve views inflation within the economy and will provide insight into how the short term rate is going to move in the next few months. So, you ask why we should care? As the fed pushes up the short-term rate, the long-term rate should follow, and I say should only due to Greenspan's Conundrum. However, bond yields have moved significantly in the past few weeks, pushing mortgage rates to recent highs.

Here is a list at the reports I will be watching for:

November 15 - Retail Sales - Strong retail sales indicate growth and strong spending. A strong number here shows the economy isn't slowing (or at least the kind of slowdown that manifests itself in consumer spending).

November 15 - Producer Price Index (PPI) - This report shows inflation pressures at the producer level. This is an important report because as that inflation pressure will eventually be pushed to the consumer.

November 16 - Consumer Price Index (CPI) - The CPI report serves to track inflation at the consumer level.

November 17 - Housing Starts and Building Permits - Reports on new homes being built by builders. A supply side indicator.

November 17 - Philly Fed

November 22 - FOMC Meeting Notes Released

November 28 - Existing Home Sales - A bit of a lagging indicator compared to housing starts but more of a demand side indicator.

November 29 - New Home Sales

Caveat Emptor,
Grim

Sunday, November 13, 2005

Lowball!

Welcome to another edition of Lowball!

Lowball! takes a look at home sales over the past week from a very different perspective. For those new to Lowball!, a lowball offer is when a buyer offers a significantly lower bid than asking in hopes that the seller accepts the offer. We take a list of home sales over the past week and pick out the sales that have the highest percentage difference between asking price and selling price.

The reason for Lowball! is to show buyers that the market has changed and buyers now have considerably more leverage than sellers. Just a short time ago, lowball offers would have been laughed at and discarded, however, not any more. The fact that so many under-asking offers are being accepted is clear proof that the market is changing.

The list does not contain all sales, I hand-pick the most interesting sales from the list. These listings might be the highest dollar drops, biggest percentage reductions, or sales in towns that are thought to still be 'hot'. Please note, even with double digit percentage reductions, these homes are still incredibly overpriced.

So let's take a look at this weeks list of Lowball! sales.

MLS# 2094005 - East Hanover, NJ
Asking Price $1,600,000
Selling Price $1,300,000 (18.8% Lowball)

MLS# 2070669 - West Paterson, NJ
Asking Price $575,000 (Originally asking an amazing $725,000)
Selling Price $500,000 (13% Lowball)

MLS# 2105356 - Green Brook, NJ
Asking Price $1,148,780
Selling Price $999,999 (13% Lowball)

MLS# 1563380 - Wayne, NJ
Asking Price $429,900
Selling Price $375,000 (12.8% Lowball)

MLS# 2073586 - South Orange, NJ
Asking Price $359,000 (Originally asking $389,000)
Selling Price $320,000 (10.9% Lowball)

MLS# 2056010 - Cranford, NJ
Asking Price $369,900
Selling Price $330,000 (10.8% Lowball)

MLS# 2076587 - Livingston, NJ
Asking Price $1,900,000 (Originally asking $2,150,000)
Selling Price $1,700,000 (10.5% Lowball)

MLS# 2073810 - Maplewood, NJ
Asking Price $315,000 (Originally asking $325,000)
Selling Price $282,000 (10.5% Lowball)

MLS# 2103281 - Parsippany, NJ
Asking Price $585,000
Selling Price $525,000 (10.3% Lowball)

MLS# 2092409 - Clifton, NJ
Asking Price $529,000
Selling Price 475,000 (10.2% Lowball)

MLS# 2201031 - New Providence, NJ
Asking Price $609,000
Selling Price $ 547,000 (10.2% Lowball)

MLS# 2092309 - Millburn, NJ
Asking Price $1,395,000 (Originally asking $1,495,000)
Selling Price $1,290,000 (7.5% Lowball)

MLS# 2102157 - Madison, NJ
Asking Price $549,000
Selling Price $510,000 (7.3% Lowball)
(About time this one sold, I believe it was relisted more than once)

To all the prospective buyers on the market. If you absolutely must buy a house today, while I can't stop you (although I might try), there is no reason to bid over asking. If you've got to buy, Lowball!

Caveat Emptor,
James

Burst Bubble Looks Inevitable..

It seems the media is getting more and more negative. They are starting to sound like a bunch of pessimistic bubble bloggers, or maybe they just opened their eyes.

Burst bubble looks inevitable

Much of the nation has had a lovely real estate boom for the last five years, but the house party is almost over and the cleanup won't be pretty.

...

In recent weeks, many major investment firms have concurred. Said a Lehman Bros. report, a "turn in the housing market is central to our economic forecast."

...

While there is disagreement on what a downturn will mean, it is widely held that a number of factors could bring prices down. A decline in prices will track interest rates: If rates go up sharply, housing prices will plummet, said Mark Zandi, chief economist at Economy.com, an independent West Chester, Pa., provider of financial research. If rates increase slowly, housing prices may ease gradually.

"House prices are at the mountaintop," Zandi said. "All roads lead down. It's just a question of how steeply."

--

The CEPR report seems to have made it's way around the web and through the press in a matter of minutes. I expected it to, it's one of the best papers on the bubble yet (you can find the link further down the page).

Caveat Emptor,
Grim

Housing boom's final hurrah?

Sunday's Star Ledger contains a special section on the real estate market..

Housing boom's final hurrah?

The statewide average sale price of $352,420 for the first six months of 2005 was more than 13 percent higher than the same period last year, according to the analysis. The study included every sale recorded in the state, making it the most thorough assessment of the market possible.

It also marks four consecutive years of double-digit gains, a wave of price appreciation that has touched nearly every corner of the state and all types of residential real estate.

But with interest rates rising, and sharp spikes predicted in home heating costs this winter, some are speculating this summer might be remembered as the housing boom's last hurrah. Analysts will be watching for the National Association of Realtor's report on home sales for the third quarter of this year, scheduled to come out on Tuesday.

...

TRYING A HOME PAGE

Still unable to find a house, Bednar channeled his frustration the modern way: He started a "blog," an online diary, devoted to observations on "our small part of the largest asset bubble in history."
The blog is among a handful of sites where users exchange information about the housing market -- all with a pessimistic bent.


"I felt there needed to be a counterpoint to all the glowing coverage of the rising home prices in the press," said Bednar, a software engineer who is studying for his master's in business administration.

...

After a real estate agent contacted him out of the blue, Kevin McGinley sold his Stone Harbor townhome this spring for more than $900,000 -- and made a $400,000 profit in just 30 months.

He then bought five more beach houses for about $5 million, using $3.5 million worth of interest-only mortgages.

McGinley said he's not worried about the market taking a downturn.

"I think I can put any of these properties on the market today and they'd be gone within a month," he said.

Hughes said even if the market slows, it's unlikely prices will free-fall to pre-2000 levels. The last time the market collapsed, in the late 1980s, the overall decline was 13 percent -- a small fraction of the 150 percent prices had risen throughout most of that decade.

"Only the people who bought at the very end of that period were hurt badly when prices fell," he said.

----

Well I suppose there is no real reason not to use my real name around here anymore. Earlier this week I spoke with the author if this piece, Bob Gebeloff, about the bubble and this blog. I provided my markedly bleak outlook on the market as well as shared some anecdotal stories about my real estate experiences. Only wish that Bob included a link to the blog from the article.

Caveat Emptor,
James