Friday, January 06, 2006

The Tsunami Effect

The Great Wave Off Kanagawa - Hokusai


One of the telltale signs of a tsunami is when the ocean quickly receeds far into the distance from the shore. This occurs when the leading edge of the Tsunami is a trough. Often times, curious onlookers will head down to the shoreline to investigate the curious phenomenon, unaware of the quickly approaching Tsunami. Unfortunately, when the onlookers see the wave quickly approaching, it's much too late. Many are swept away in the quickly rising floodwaters.

Active listings in Northern New Jersey on the GSMLS began a similar recession beginning in mid-November of last year. Listings quickly fell from near 13,000 (GSMLS Active Listings for Bergen, Essex, Hudson, Passaic, Morris, Somerset, Sussex, Union and Warren Counties) in mid-November to a low near 11,000 in late December, a decline of approximately 15%.

Like the curious phenomenon of the receeding ocean, the drop in active listings is often described as a healthy sign of demand in our current market. A sign that demand is still high and supply low. However, how many of these listings were removed only temporarily, to be relisted in the near future?

I dub this the Tsunami Effect, when levels of supply are reduced temporarily by a large group of individuals in hopes of bringing that supply back to a healthier market. But this huge influx of supply causes the market to collapse. Now, I'm sure the economists in the house are saying, "Grim, you've gone out of your way to explain a known phenomenon called supply shock." Yes, but with a subtle difference. The temporary reduction that preceeds the supply shock. This temporary reduction is similar to the curiosity of the receeding ocean that draws in curious observers.

Many market analysts expected inventory to decrease through the early spring until February, when listings would begin to increase again. Mostly a reiteration of what we've seen in the Northern New Jersey market historically. However, quite curiously, it appears that analysts may have underestimated the public.

January GSMLS Inventory

January 3 - 11010
January 4 - 11047
January 5 - 11107
January 6 - 11127

An increase of over 1% in 4 days. The last time we saw an increase this significant over a 4 day period was at the height of the speculative market in early September. In a period where active listings would normally be declining, an increase of 1% may just be the precursor to the Tsunami.

Don't be lured to curiosity by the receding waters.

Caveat Emptor,
Grim

Head NAR Cheerleader David Lereah Changes Tune

Here are a handful of new quotes from the Chief Economist at the National Association of Realtors, David Lereah. Many here will immediately recognize Mr. Lereah as the head cheerleader and media spin master of the organization. Mr. Lereah has been one of the most outspoken pro-real estate spokesmen to date, doing everything in his power to turn asset bubbles into pretty balloons. Lately the tune from the NAR spokesman has been changing. Many have speculated that the NAR realizes that the housing collapse fallout will more than negatively impact their organization, so they've been trying to play the cover their as* card as much as possible lately, so that they can point back to it in the future saying "we were honest, we told you so."

Investors are unknown factor in 2006 real estate market

"It's difficult to follow the strongest year ever," said David Lereah, chief economist for the National Association of Realtors trade group, which has about 1.2 million members. "The boom is obviously winding down. That's what we're all saying and observing." Existing-home sales should drop about 4 percent to 5 percent this year, compared to the 2005 levels, Lereah said, and new-home sales should drop about 5 percent to 6 percent year-over-year.

Price drops are possible in some "very, very hot metro markets," he added, though "it's very difficult to know which markets they will be right now." Nationwide, though, Lereah expects home-price appreciation to be up about 6.1 percent this year, compared to a rise of 13 percent in 2005.

Wait a minute Mr. Lereah, what happened to "Home Prices Never Go Down"? A few months back you wouldn't even entertain the notion of overheated markets. Now you acknowledge that certain hot markets are poised to decline? These hints being dropped by the NAR should not be taken lightly. If anyone has a vested interest in the bubble continuing it's the NAR. For them to acknowledge any weakness, no matter how small, should be taken as a sign that they are indeed trying to cover their collective backsides.

As for investors, Lereah said, "Investor activity is by far ... the biggest risk that the housing sector is going to face this year, because investor activity had gotten to levels that we had never seen before. And we are in uncharted territory." Speculators who bought properties to flip quickly may be left at a loss, as interest rates are rising and the market is in transition from a seller's market to a buyer's market.

Yes Mr. Lereah, you are correct, we are in uncharted territory. About time you stated that publically, we've been yelling about it for what seems like years now. Unfortunately, once the fallout begins, it won't just be speculators and investors who are going to feel the pain, it's going to be the entire housing market.

David Seiders, chief economist for the National Association of Home Builders trade group, said, "I think the biggest risk would be for investors not only to stop investing, but to move those units back onto the market in large volume, and that could create a bigger problem. This is kind of new to us," he said, adding that it's a "major uncertainty" where investors would put their money if they pulled it out of the real estate market.

Oh look, another chief economist. Yes Mr. Seiders, the phenomenon is called supply shock. When speculators start to bleed money and it's obvious that home values are falling these speculators will indeed dump their supply. Panic selling? Perhaps. But there is no question that speculators dumping inventory will negatively impact all markets.

"All of us will be observing keenly," Lereah said. In March 2005, the Realtor trade group released a study that showed a high level of investor activity in the housing market: 23 percent of all homes purchased in 2004 were for investment, and another 13 percent were vacation homes.

A quarter of all recent home purchases were speculative in nature? How many more we're "me too" purchases by unqualified buyers using funny money mortgages? What happens when these homes start to get fed back into the available market? The same momentum that brought asset prices up can bring them back down.

Caveat Emptor!
Grim

Thursday, January 05, 2006

Northern NJ December '05 Residential Home Sales

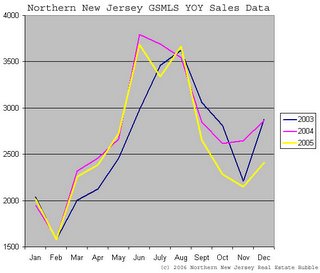
I've finished gathering the December 2005 Residential Home Sales Data (from GSMLS). This data is ours, gathered by my team. As soon as the prior months statistics are available, we gather that data and compare it, YOY, with the 2003 and 2004 sales data to determine trends within the current real estate market.

I believe this to be the most up-to-date indicator available for the Northern New Jersey market. Why? Because anything else either lags the market by many months, or aggregates data into quarters.

The data shows what we've been seeing and hearing anecdotally for Northern NJ. While December sales did increase over November as usual, sales were significantly below what was seen in 2003 and 2004.


This data is not seasonally adjusted and consists of sales of GSMLS listed properties in Bergen, Essex, Hudson, Morris, Passaic, Somerset, Sussex, Union, and Warren counties. This data does not include sales from other listing services (NJMLS or Hudson MLS) nor does it contain FSBO sales. However, GSMLS is the largest MLS service in Northern NJ, thus we're confident that the data provided is representative of the market.

December 2005 sales were approximately 15% lower than both December 2003 and 2004, in line with anecdotal evidence as well as the NAR Pending Home Sales Index data posted for November.

While demand is still following typical seasonal patterns the trend is unmistakably downwards. The cooling of the Northern NJ market should be fairly obvious at this point. Waining demand isn't due to seasonal factors, it's due to significant changes in consumer psychology. I can't see how there will be any soft landing for Northern NJ.

Caveat Emptor!
Grim

Northeast Bubble Collapsing Quickly

The NAR released the November Pending Home Sales Index (PHSI) data today.

November PHSI PDF

The NAR data shows that the Northeast may actually be leading the housing bubble decline. Many had thought that it would be the west coast or southwest markets that led, but data shows otherwise.

In November, the index fell 8.3% over last month, and -8.0% over last year (seasonally adjusted).

Bloomberg is also reporting on the index decline:

U.S. November Pending Sales of Existing Homes Falls 2.5%

Contracts to buy previously owned U.S. homes fell in November, a third straight decline that adds to evidence the U.S. housing market is slowing heading into 2006.

The index of signed purchase agreements, or pending home resales, fell 2.5 percent to 120.6, the National Association of Realtors said today in Washington. That follows a revised reading of 123.7 in October and a record 129.2 in August.

...

``The extended boom in home sales appears to have run its course,'' in 2006, said Robert Mellman, an economist at JPMorgan Chase Bank in New York, before the report. ``The housing market frenzy that enticed potential homebuyers to rush into purchases before prices moved still higher has now apparently broken.''

...

The November pending resales index fell in three of the four regions compared with the prior month. Resales declined 8.3 percent in the Northeast, 5.1 percent in the West and 1.9 percent in the South. Contract signings rose 3.4 percent in the Midwest.

Caveat Emptor!
Grim

Wednesday, January 04, 2006

Manhattan Falling

With all the Manhattan talk around here lately, I thought this piece was relevant. Hot off the presses at CNN Money:

Manhattan real estate hits wall

Manhattan real estate may have hit a wall -- albeit a very high one. The last half of 2005 saw home prices lag, according to two new reports from Manhattan brokers.

According to Prudential Douglas Elliman, the median sale price for co-ops and condos in Manhattan rose just 1.3 percent in the fourth quarter of 2005, to $760,000. The Corcoran Group found that median sales price declined during the quarter, with a 4 percent slide.

...

The Manhattan slowdown comes on the heels of similar drops in the third quarter in some of the nation's most expensive real estate markets. Boston and other Bay State areas, many California markets, the Washington D.C. area, and suburban New York counties, all recorded lower or flattening prices, according to National City, a financial holding company.

According to Pamela Liebman, Corcoran's CEO, the Manhattan market began to soften in the third quarter, owing in part to rising energy costs and media reports of the real estate bubble. (Love it, these guys are blaming the media for the bubble bursting)

Locally, a lot of new inventory came on the market. Some 5,764 residences were in the listing inventory, a huge 52 percent increase over the past year.

...

"We can't extrapolate national trends from Manhattan markets," says Richard DeKaser, chief economist for National City Corp. But the turn in Gotham prices does mirror what has happened in many other pricey regions.

It's evidence of what DeKaser calls "the turning of the housing market."

The average Boston sale price declined 2 percent in the third quarter of 2005, according to data from National City's Housing Valuation Analysis. San Francisco real estate fell about 1.2 percent and San Diego 1.5 percent. Washington D.C. rose, but only by about 1.3 percent and Los Angeles went up 1.2 percent during the quarter. Prices in northern New Jersey and in Nassau/Suffolk Counties in New York also fell.

DeKaser expects price increases nationwide to continue to slow. "Demand and market price appreciation peaked sometime this summer. What we're seeing now is an orderly retreat," he says.

Caveat Emptor,
Grim

Tuesday, January 03, 2006

Predictions For The New Year

As always, with the new year comes new predictions. However, these predicitions are nothing new to readers of this and the other housing bubble blogs. We've been saying much of the same for years now, but now that the bubble has gone mainstream, it's everywhere. Here is a new piece from BusinessWeek online this morning:

Fasten Your Seat Belts in '06 -Housing prices look like tech stocks at the height of the dot-com boom, so expect a nasty slump. Meanwhile, bet on tech to soar

...

The housing bubble is now officially bigger than the tech bubble ever was. At the peak of the frenzy in 2000, consumer and business spending on tech software and hardware absorbed 6% of economic output. Today, residential construction takes 6.1% of output -- that's the biggest share of the economy devoted to housing since 1955. And remember, that was smack-dab in the middle of the postwar baby boom.

...

Home-building stocks have quadrupled in price since 2001. That's almost as great as the runup in tech stocks from 1997 to the peak in 2000. Haven't we learned anything?

...

I put this all together and draw several conclusions. The housing bubble could well trace the same path as the tech bubble: A big rise that convinces even the skeptics to invest -- this time in real estate -- followed by a sharp decline that exceeds even the worst of fears.

...

And don't listen to people who tell you that because everyone needs a place to live, housing is more bust-resistant than technology. In 2000 and 2001, the conventional wisdom said that technology spending was recession-proof because companies couldn't afford to cut back.

...

This time, the result of oversupply will be equally grim: Home prices will fall sharply in many areas, not just go flat. I even expect the national price for homes to decline by a bit. Construction and mortgage lending will slow sharply, and the whole psychology of the real estate market will change. Homebuilding stocks will give back most if not all of their astonishing gains. This will not be pretty.

Caveat Emptor!
Grim

Monday, January 02, 2006

Price Reduced! 12/20 - 01/02

Welcome to another edition of Price Reduced!

For all the newcomers to this blog, Price Reduced! takes a look at a handful of significant price reductions across Northern NJ. The purpose of this exercise is to serve as proof that the Northern New Jersey real estate market has long since been overvalued and has started the long hard decline back to the mean. These listings are in no way an endorsement by myself, nor do I believe they are a bargain or a value. Even reduced, I still believe these homes are still grossly overpriced. With that, the listings please!

MLS# 2228700 - Franklin Twp, NJ
Listing Price $389,900
Reduced Price $314,900 (19.24% Reduction)

MLS# 2110525- Jefferson, NJ
Listing Price $355,000 (Reduced from $372,500)
Reduced Price $297,500 (16.20% Reduction, 20.13% off OLP)

MLS# 2206347 - Boonton, NJ
Listing Price $149,000 (Reduced from $169,000)
Reduced Price $129,000 (13.42% Reduction, 23.66% off OLP)

MLS# 2202648 - Mendham, NJ
Listing Price $845,000
Reduced Price $745,000 (11.83% Reduction)

MLS# 2209546 - Montague Twp, NJ
Listing Price $427,000
Reduced Price $377,000 (11.71% Reduction)

MLS# 2091083 - Phillipsburg, NJ
Listing Price $129,900 (Reduced from $139,900)
Reduced Price $115,000 (11.47% Reduction, 17.79% off OLP)

MLS# 2212566 - Wayne, NJ
Listing Price $899,999 (Reduced from $999,999)
Reduced Price $799,999 (11.11% Reduction, 20% off OLP)

MLS# 2207687 - Oakland, NJ
Listing Price $534,000 (Reduced from $559,000)
Reduced Price $474,800 (11.09% Reduction, 15.06% off OLP)

MLS# 2224934 - Teaneck, NJ
Listing Price $353,900
Reduced Price $314,900 (11.02% Reduction)

MLS# 2222617 - Scotch Plains, NJ
Listing Price $759,900
Reduced Price $679,000 (10.65% Reduction)

MLS# 2222830 - Montclair, NJ
Listing Price $369,000
Reduced Price $329,900 (10.60% Reduction)

MLS# 2211166 - Mount Olive, NJ
Listing Price $279,000
Reduced Price $250,000 (10.39% Reduction)

MLS# 2228462 - Mendham, NJ
Listing Price $1,999,000
Reduced Price $1,799,000 (10.01% Reduction)

Now, to all the potential buyers reading this blog, I am not posting this information for you to drool over thinking these are great deals. These are not great deals. These are the first price reductions along a very long road downward. If I threw a knife up into the air, would you try to catch it on the way down? No, you'd wait until it hit the ground and then pick it up. The same rule applies here. Alot of people lost alot of money buying on the downside of the stock market after the Nasdaq crash in hopes of a fast recovery. There will be no fast recovery here. Sit tight, grab some popcorn and enjoy the ride.

I tried to grab an across the board sample of towns and price points for this edition, hope you enjoyed it!

Caveat Emptor!
Grim