Saturday, November 26, 2005

Price Reduced! 11/19 - 11/26

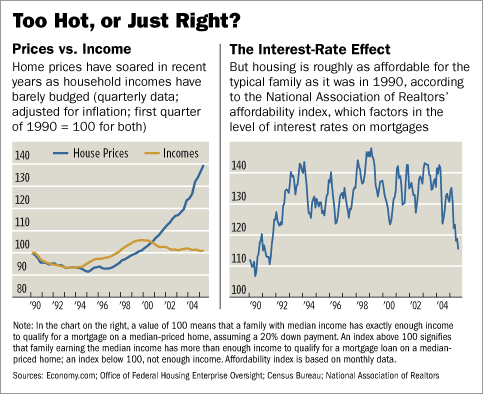
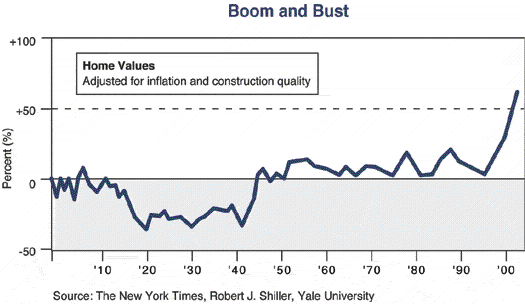
It's time for yet another episode of Price Reduced! For all the newcomers to this blog, Price Reduced! takes a good look at a handful of significant price reductions across Northern NJ. The purpose of this exercise is to serve as proof that the Northern New Jersey real estate market has long since been overvalued and has started the long hard decline back to the mean. These listings are in no way an endorsement by myself, nor do I believe they are a bargain or a value. Even reduced, I still believe these homes are still grossly overpriced. With that, the listings please!

MLS# 2218495 - Belleville, NJ
Original Price $210,000
Reduced Price $155,000 (26.2% Reduction)

MLS# 2060526 - Hardyston, NJ
Original Price $1,199,900
Reduced Price $989,900 (17.5% Reduction)

MLS# 2093259 - Clifton, NJ
Original Price $300,000 (Reduced from $329,900)
Reduced Price $249,999 (16.7% Reduction)

MLS# 2200794 - Millburn, NJ
Original Price $1,550,000
Reduced Price $1,300,000 (16.1% Reduction)

MLS# 2210412 - Parsippany, NJ
Original Price $389,900
Reduced Price $329,900 (15.4% Reduction)

MLS# 2101635 - Newark, NJ
Original Price $699,900
Reduced Price $599,999 (14.3% Reduction)

MLS# 2203333 - Bloomfield, NJ
Original Price $725,000
Reduced Price $625,000 (13.8% Reduction)

MLS# 2200880 - Madison, NJ
Original Price $1,495,000
Reduced Price $1,295,000 (13.3% Reduction)

MLS# 2108706 - Mendham, NJ
Original Price $1,425,000
Reduced Price $1,250,000 (12.3% Reduction

MLS# 2211051 - Roxbury, NJ
Original Price $439,900
Reduced Price $390,000 (11.3% Reduction)

MLS# 2095841 - Blairstown, NJ
Original Price $640,000
Reduced Price $570,000 (11% Reduction)

MLS# 2212566 - Wayne, NJ
Original Price $999,999
Reduced Price $899,999 (10% Reduction)

And now, for some jaw dropping statistics (GSMLS Only)..

Reduced Listings This Week: 554
Average Price Reduction: 4.12%
Total Dollar Reduction: $12,015,099

I tried to grab a set of towns I haven't grabbed before. If someone asked for a particular town and I didn't include it, just please reply to this post and I'll drop one or two in for you.

Now, to all the buyers and readers of this blog, I am not posting this information for you to drool over thinking these are great deals. These are not great deals. These are the first price reductions along a very long road downward. If I threw a knife up into the air, would you try to catch it on the way down? No, you'd wait until it hit the ground and then pick it up. The same rule applies here. Alot of people lost alot of money buying on the downside of the stock market after the Nasdaq crash in hopes of a fast recovery. There will be no fast recovery here. Sit tight, grab some popcorn and enjoy the ride.

Caveat Emptor!
Grim

Friday, November 25, 2005

Economic Calendar

We've got a rather full economic calendar next week.

Monday 11/28
New Home Starts

Tuesday 11/29
Durable Orders
Consumer Confidence
New Home Sales

Wednesday 11/30
Preliminary Q3 GDP & Chain Deflator
Chicago PMI
Fed Beige Book

Thursday 12/1
Auto and Truck Sales
Initial Claims
Income, Spending, and Savings Rates (I'm especially keeping an eye on this one)
Construction Spending
ISM Index

Friday 12/2
Nonfarm Payrolls
Unemployment Rate
Hourly Earnings

-grim

Wednesday, November 23, 2005

Weekly Inventory Update

It's Wednesday and time again for the weekly inventory update. It's a historic event actually, the first time we've seen a real decline in the GSMLS Active Listings in quite some time. When I noticed this today, I decided to do a bit digging into the underlying activity behind the change this week, what I found was rather interesting, but first the numbers:

GSMLS
11/16 - 12833
11/23 - 12693

NJMLS
11/16 - 5801
11/23 - 5811

Hudson MLS
11/16 - 1764
11/23 - 1784

Now let's explore what I found happened to the GSMLS numbers this week. At first glance someone might see the decline and proclaim "They are buying again!" Sorry, but that doesn't seem to be the case, the active listings did decline, but it wasn't because of sales.

Here is a breakdown of the weekly activity on GSMLS for Northern NJ (Ber, Ess, Hud, Mor, Pas, Som, Sus, Uni, War):

New Listings: 831
Back on Market: 130
Total Listings Added To Active: 960

Total Listings Sold: 670

At this point you are probably saying, "Grim, but you said we saw a decline, how can it be?" I asked myself the same question, and dug deeper yet.

Expired Listings: 194
Withdrawn Listings: 191
Temporarily Withdrawn: 92

Total Withdrawn or Expired: 477

Ah hah! Now it makes sense! We had a net loss of 186 listings, but it wasn't due to sales picking up. Comparing a real demand (Sales) of 670 with a supply of 961 still shows us that inventory is being added at a rate faster than consumers are purchasing. So what about the withdrawn or expired listings? Well who knows really, but I have a feeling we'll be seeing them back in the spring.

Caveat Emptor!
Grim

Mortgage Activity Drops, Rates Ease

Mortgage activity dropped last month, according to the MBA, declining 3.4% (seasonally adjusted).

U.S. mortgage applications fall last week - MBA

U.S. mortgage applications fell last week, dragged down by a slump in home refinancings which hit a 16-month low as interest rates remained close to their highest levels this year, industry trade group figures showed on Wednesday.
...
The MBA's seasonally adjusted purchase mortgage index fell 1.2 percent to 472.3.The index is considered a timely gauge on U.S. home sales.
...
The group's seasonally adjusted index of refinancing applications dropped 6.9 percent to 1,584.1. The refinancing index is down 17.4 percent compared with four weeks ago, and volume was at its lowest level since the week ended June 25, 2004 when the index reached 1,386.9, the MBA said.

Rates did moderate a bit this week, the 10Y bond yields dropped a bit, allowing the mortgage lenders a little more leeway.

Caveat Emptor!
Grim

Real Estate HowTo: Finding The Address

On behalf of the holiday, I'm posting up this HowTo earlier than I was intending to. Since one of our readers (Richie) let the cat out of the bag on this question, it makes no sense to hold back.

One of the most common questions I get is, "How do I find an address if I am looking at a listing online?" It's a valid question. Many times a buyer might want to do a drive by without having to get involved with an agent. Maybe your agent only services a small area and you are interested in another area as well (but don't want to hurt his/her feelings).

However, in the past, the answer was usually, "ask your real estate agent."

Sure, and that's probably the best way to find the information. Not all agents are terrible people looking to push you into this.

Here is a handful of ways to find the address you are looking for:

The Straightforward Approach
Ask your personal real estate agent for the information, they'll give it to you. I am not anti-agent. In fact, (and this may come as a shock), I do have a real estate agent. She has been in the business for many years and I trust her opinion. She knows my position in the market and understands it. She also understands the current market. Are all agents good? No, in fact I think the majority of them aren't qualified to wash your laundry.

Social Engineering
Call the listing agent and tell them you don't have an agent in the area, but are interested, they will not give you the address, so don't ask. However, tell them you are familiar with the area and would like to know what street the home is on, or what neighborhood. If you get the street, just use the taxrecords database to pinpoint the property by using the assessed value. Or, if the assessed value is common (returns many listings), just use MapQuest to help you narrow down the search. Matching land/improvements assessed values will help you pinpoint.

Open House Listings
Use the weichert.com or other realtor website to search the upcoming open houses. This isn't a very accurate method, but sometimes you hit one.

New Listings Services
Sign up for one of the many "Just listed" services over the internet. I know some people that use justlisted.com. However, keep in mind, these services will send your search information to a real estate agent. That agent will then send you listings on a regular basis. If you don't want to be associated with an agent, do not use these services. You can always sign up for a gmail account and make up some information.

Assessed Values Search
This is the goldmine. This is also the one method that *no one* will share with you, well, that is except certain readers here and myself. The other methods do not require any walkthru for you to do, this one is a bit more complicated, so I'll follow the same format I used in the previous HowTo. Make sure you know how to use the tax databases before you attempt to walk through this process.

1) First you need to find the land and improvements assessments for the property you are interested. Open a browser to:

www.gsmls.com

2) Click "Search for Properties", this will bring up a map of NJ. Click Morris County. This will bring up a map of Morris. In the drop down under "Cities/Towns" on the left, select "Chatham Bor." Scroll down and click the "Continue" button.

3) Select a List price from "500,000" to "550,000" and click the "Search Now" button. Follow this path, I'm pushing you to a listing I've preselected to use in the walk-thru, and I'll explain why later on.

4) Look for MLS# 2214727. The current asking is $549,000. Under the picture of the home, there is a text link that says "More details", click it.

5) This is the typical detailed MLS info screen, it gives you quite a bit of information, but no address. However, look for the values for "Building Assessment, Land Assessment, Total Assessment". That is the data we are interested in. For reference, we'll grab the total assessment value of $493,400.

6) Bring up the Monmouth tax website. Select Morris, Chatham Bor., and do an Advanced Search.

7) Scroll down the page until you see the fields labelled "Net:". In the "From" column only, enter in the total assessed value of 493400 (no special characters). Leave to "To" column blank. Click the "Submit Search" button.

8) If you did everything correctly, you'll be rewarded with the information you are seeking.

Here are the issues when doing total assessment searches:

1) You don't find anything. If this happens, try searching by just the land or improvement data separately. Or, search with a range to try to narrow down.

2) You find too many. Use the individual assessment values to pinpoint the record in question.

3) You still don't find anything. Sorry, you are out of luck, use another method.

Sorry if this one seems rushed!

Caveat Emptor!
Grim

Real Estate HowTo: Searching Tax Records

Here is the first part in our HowTo series:

HowTo: Searching Tax Records

The purpose of the HowTo series is to educate home buyers. While I'd love to hang around the blog helping everyone hunt down information, I realize that I can probably help everyone much more by showing you HowTo find the info you need.

The first part in the series is HowTo track down public tax information. The public tax databases contain a wealth of important information that will help you become educated homebuyers. Until recently, searching the tax records involved a trip down to the county records office, and probably the better part of an afternoon. Not anymore, with just a few clicks I'm going to turn you into Sherlock Homes (what a terrible pun).

First, here are the links I use:

Morris County Tax Board

Monmouth County Tax Board

www.taxrecords.com

Bergen County Tax Board (taxrecords.com database)

Why so many links? Open them up, take a look, not every site has the most up-to-date database, and some sites (like Monmouth) allow you to search more than one county.

So lets begin:

1) First we need to find the address of a home we are interested in. For this we'll go over to ForSaleByOwner.com, you can use the link over to the right of the page if you would like to support the site (I'm still waiting to make my first penny off those by the way).

2) At the top of the page there is a section called "Buying a home", lets type in Madison for the city, and use NJ for the state, click go.

3) Choose listing #20527608 ($599,000). Not every home has past sales records, if the home was owned for a very long period of time, it's possible that you will not find past sales records. Also, if the home is new, you may not find sales records. I picked Madison at random and chose this listing at random (but verified that it indeed had sales data).

4) Grab the address, the address is important, it's the key we'll be using to search the databases (for those that would rather not go to forsalebyowner.com, the address is "36 Albright".

5) Click the link for the Monmouth Tax Board, you'll see a page with a somewhat complicated form, don't be scared, it's easy.

6) Select "Morris - 2005" as your County, Select "Madison Borough" as your District, and Select "Advanced Search" as your Search Format.

7) Scroll down the page until you see the field marked "Street Addr", type in "36 Albright", the street suffix is not necessary (and I find it throws off the search on some tools, so don't bother). Scroll down to the bottom of the page and click the "Search" button.

8) You should be rewarded with a single entry returned. Click the "More Information" button on the left side of the record.

9) This is it, you've done it. We see the owners, we can verify what they paid for the home and when they purchased it, the assessed value and what the taxes are.

10) Click your back button twice to return back to the search screen. This time, we'll only use "Albright" as the Street Address. Why? Because we'd like to see the other properties in the neighborhood.

11) Now we'll go through the Morris County Tax Board site. Why? You might like it better, it might be updated more recently, the Monmouth Site might be down, It doesn't matter, just go.

12) At the top of the page you should see "SR1A's", hover your mouse over the button and you'll see "Search SR1A's" pop up, click it.

13) Click "Search SR1A's By Property Location" under "Select Search Critera". A box should pop up with a handful of fields.

14) Under District select "Madison", enter "36" for House Number and "Albright" for Street Address. You can leave SR1A Year blank. Click "Search".

15) Bingo, you'll see a similar record as we did in the first search. You may need to scroll the browser window to the right to reveal the "Detail" button. Click it when you find it. You'll see much of the same info as you did before. You can go back and click the "Tax" button if you'd like some more information on the property or tax.

16) I'll let you go through the Bergen and taxrecords.com sites on your own. Most of these follow the same pattern, so once you've mastered the search, you'll be comfortable on most any tax search database.

You've now become tax record experts, and are probably wondering why I wanted you all to become tax record experts. It's simple really, because we need to know what the current owner purchased the home for, and when they purchased it. Home values typically appreciate at about the rate of inflation. So we can use the inflation numbers to calculate the inflation adjusted price of the home in today's dollars. This will give you a good starting point for which to base your offer. "But wait," you ask, "what about the asking price?" Asking price? We here at NNJBubble believe no such thing, you can ask what you'd like, it doesn't mean we're going to pay it. We only pay what we believe the asset to be worth, no more. We don't care what the neighbor got for his place, we don't care how well the market did in the past year, we simply don't care.

Refuse to buy into the mania and refuse to pay the asking price. If the seller rejects your offer, walk away, do not buy, do not bend, and do not let this process become emotional.

Caveat Emptor,
Grim

Tuesday, November 22, 2005

Lowball! Special Edition

I'll skip the Lowball! opening paragraphs. This special edition of Lowball! is for all the readers that inquired about specific towns in Northern NJ.

Edison - 9 Sales from 11/1-11/21
MLS# 2101741 - Waterford
Asking Price $282,500
Selling Price $277,000 (2% Lowball)

MLS# 2103902 - Clive
Asking Price $649,900
Selling Price $625,500 (3.8% Lowball)

MLS# 2057516 - New Dover
Asking Price $684,900
Selling Price $600,000 (12.4% Lowball)

Piscataway - 12 Sales from 11/1-11/21
MLS# 2100382 - Jesse
Asking Price $304,900
Selling Price $285,000 (6.5% Lowball)

MLS# 2106439 - Barclay
Asking Price $399,500
Selling Price $370,000 (7.4% Lowball)

MLS# 2099274 - Burgess
Asking Price $434,900
Selling Price $395,000 (9.2% Lowball)

Elizabeth - 14 Sales from 11/1-11/21
MLS# 2101893 - Jaques
AskingPrice $175,000
Selling Price $168,500 (3.7% Lowball)

MLS# 2211392 - Kipling
Asking Price $389,000
Selling Price $330,000 (15.2% Lowball)

MLS# 2091908 - Wyoming
Asking Price $439,000
Selling Price $430,000 (2.1% Lowball)

Morristown - 9 Sales from 11/1 - 11/21
MLS#2086992 - Village
Asking Price $375,000
Selling Price $359,000 (4.3% Lowball)

MLS# 2099104 - Ridgedale
Asking Price $414,900
Selling Price $400,000 (3.6% Lowball)

MLS# 2064289 - South
Asking Price $419,500 (Originally $449,000)
Selling Price $325,000 (22.5% Lowball)

Summit - 19 Sales from 11/1-11/21
MLS# 2100316 - Glenside
Asking Price $439,000
Selling Price $430,000 (2.1% Lowball)

MLS# 2105817 - Michigan
Asking Price $590,000
Selling Price $570,000 (3.4% Lowball)

MLS#2081596 - Linden
Asking Price $799,900 (Originally $819,000)
Selling Price $765,000 (4.4% Lowball, 6.6% Off Original)

Caveat Emptor!
Grim

Monday, November 21, 2005

Can anyone afford to buy a home in New Jersey?

Can anyone really afford Northern New Jersey anymore? There is no question that affordability is bordering on just about impossible unless you are making at least twice the median income, and even then you don't get much to show for your precious dollars.

The Center for Housing Policy does a yearly study, the Paycheck to Paycheck, to evaluate just how affordable housing is for workers.

When it comes to the health and vitality of America’s communities, affordable housing is key. And where it is lacking, the challenges are formidable. Local governments deal with overcrowding and congestion. Employers struggle to attract and retain the labor force so vital to their bottom line. Low- to moderate-income working families work longer hours, endure long commutes or cut back on basic necessities in order to pay for housing.

Who are among the ranks of America’s workers struggling to afford housing? In some high-priced communities, people who provide the bulk of vital services – teachers, firefighters, police officers, retail sales workers and restaurant workers – cannot afford to live in the communities they serve. Even in more moderately-priced communities, people who work a full-time job pay an excessive portion of their income for housing.

They put together a very nice website that allows you to choose an area and choose a set of professions to map just how affordable the housing market is for 'every day workers'..

To save you some time, I went ahead and ran the analysis for Atlantic City, Bergen, Newark, and Middlesex.


With affordability this low, can anyone afford to buy a home anymore?

Caveat Emptor,
Grim

BusinessWeek Hot Properties Blog

I didn't know BusinessWeek Online had a real estate blog until I came across it just a few minutes ago, much to my surprise actually. I've always believed it to be proper web etiquette to link back to someone who linked to you. So with that, I'd like to thank Sam Coy for providing the link to my blog and provide a link back to the BusinessWeek Hot Properties Blog in return.

BusinessWeek Online Hot Properties

Lowballing is the profitable game of submitting a ludicrously low bid on a house just to see if the seller goes for it. The game didn't get played much over the past few years, when houses were sold within hours for above the asking price. But for obvious reasons it seems to be enjoying a resurgence of popularity.

I just found this
new blog about the northern New Jersey housing market. The blogger, named James Bednar, aka "Grim," posted an item Saturday about houses that sold recently for way below their asking price, including one in Madison, N.J., that was listed for $2.89 million and sold for $2.3 million.

It seems just about everyone gets a kick out of Lowball! I get quite a bit of email from readers asking me to post Lowball! sales from specific towns and areas, and I usually try to accomodate them. In case you are wondering why I pick some of the towns I do pick, it's usually because someone had asked.

If anyone would like me to keep an eye out for specific towns and price ranges, just respond to this thread and let me know!

Caveat Emptor!
Grim

Sellers Slump Is A Harsh Realty In Tri-State

Thanks to the author, Braden Keil for giving us the heads up about his article in the NY Post.

Sellers Slump Is A Harsh Realty In Tri-State

November 21, 2005 -- The chill in the Manhattan residential real-estate market is blowing across the city's suburbs and outer boroughs.

From Westchester County to Fairfield, Conn., to Bergen, N.J., the tri-state area is seeing prices and numbers of sales stalling or dropping, while inventories of properties are starting to pile up.

"Sales are drying up at the top," said one northern New Jersey broker. "And now homes on the lower end [of the price scale] are sitting for weeks and months."

...

A Post survey of northern New Jersey brokers showed similar dismal results, with prices ranging from flat in working-class areas to dropping nearly 10 percent in more affluent communities.

Caveat Emptor!
Grim

Fundamental Update

I was feverishly trying to find a graph of inflation adjusted wages to home prices yesterday, but wasn't able to find a good graph. Was going through the Wall Street Journal today, and what do you know, one of the best yet..


I often find it very hard to explain these concepts to people using words or tables, it just doesn't 'click'. But when you take a look at a chart like this, it's hard not to understand. The fact is, wages really haven't risen substantially, and neither has rent. Population has not significant increased in the past five years, which means it's highly unlikely there is a true supply issue.

Here is a link to the WSJ article, I didn't particularly care for it, but since I used the graph, I might as well provide the link back..

What's Behind the Boom

Caveat Emptor,
Grim

Sunday, November 20, 2005

A 'Fundamental' Look At Home Values

It's been a rather quiet weekend on the New Jersey Bubble news front. I've had a few things on the back-burner, so now seems like a good time to pull them out. This first one is on the fundamentals that govern home prices.. Let's take a look.

Historically, home values have tracked three different fundamentals very closely, the relationship is well known, and the reasons behind them are sound. Those three fundamentals are local wages, local rents, and inflation. Wages and rents are the obvious fundamentals, so let's take a quick look at those first.

Local wages and rents are tightly intertwined. If wages rise, it's likely a sign that rents will rise shortly there after. Likewise, increased rental prices put wage pressures on local employers (I personally think this scenario is all but impossible in many areas, it would require that the entire local rental stock be controlled by a monopoly). But both typically move together rather tightly. Over the past few years, wage increases have been minimal, as have rental increases.

Lets take a look at median wage increases in New Jersey:

NJ Median Income

1996-1997 $56,506
1997-1998 $57,816
1998-1999 $58,092
1999-2000 $57,438
2000-2001 $56,895
2001-2002 $57,441
2002-2003 $58,313
2003-2004 $57,007

As you can see, median wages have been relatively flat. So lets take a look at how median rents have moved.

Housing Info

Median Rent For NJ

2001 $625
2000 $618
2002 $638
2003 $670
2004 $685

So it's pretty obvious, both rents and wages stayed pretty much confined and in-check throughout the housing bubble. The wage and rent fundamentals are still pretty tightly bound.

So that leaves inflation. Housing has always been thought of as a hedge against inflation, but seldom much more than that. A chart by Shiller that appeared in the NYT illustrates that very well.


Aside from that little dip we refer to as the Great Depression", it's obvious that home values have appreciated at rates slightly higher than inflation. Had inflation significant increased since 1990, we wouldn't have seen the spike. Now, I'm sure we can get into an argument about how the government is keeping the inflation calculations low so it doesn't need to pay COLA, but I'd prefer to table that one..
Caveat Emptor!
Grim